


Key Takeaways
-
Learn how VC fund performance benchmarks help investors compare results across market cycles and understand the spread between average and top quartile VC fund performance.
-
See why reviewing top quartile VC fund performance by year offers clarity on return expectations and highlights patterns that can guide long term strategy.
-
Understand how VC fund performance metrics and venture capital historical returns work together to reveal trends, pacing, and risk across different vintage years.
-
Explore how U.S. venture capital investment by year influences valuations, exit timing, and long term outcomes that appear in benchmark data.
-
Discover how to apply the best VC fund performance benchmarks by year when evaluating new funds so you can make more informed and confident investment decisions.
VC Fund Performance Benchmarks: Why They Matter for Investors
Understanding how venture capital funds perform over time helps investors make informed decisions. Benchmarks offer a clear view of historical patterns, the spread between average and top-performing funds, and the dynamics that shape long-term returns. Investors who learn how these comparisons work can better evaluate opportunities, understand risk, and build stronger strategies that align with long-term goals.
VC fund performance benchmarks provide a structured framework for interpreting a wide range of market information. These measurements help investors evaluate how different strategies perform over time and how structural changes in the economy affect fund performance. Investors who take time to understand these comparisons gain a clearer sense of how top performers separate themselves and how average returns shift across market cycles.
As investors deepen their experience with benchmark data, they begin to recognize how venture outcomes reflect broader market forces. Fund strategies respond to shifts in sectors, fundraising environments, and exit opportunities. Benchmark data captures these shifts predictably and provides investors with a baseline for comparing current conditions with past events. This helps reduce noise, clarify trends, and guide better decision-making.
What VC Fund Performance Benchmarks Show
VC fund performance benchmarks help investors understand how results change by vintage year and how outcomes vary across the market. These comparisons show the difference between average VC fund performance and top-quartile VC fund performance. Reviewing top-quartile VC fund performance by year helps investors see how economic cycles and investment trends shape returns. Many investors use the best VC fund performance benchmarks by year to anchor expectations when reviewing new opportunities and building long-term forecasts.
Understanding what these benchmarks reveal can be especially helpful for newer investors who are still learning how the asset class behaves. Benchmarks reflect the influence of valuations, deal flow, exit markets, and broader economic conditions. This helps readers understand why certain years produce stronger or weaker results and why performance can shift rapidly when market conditions change. Since benchmarks aggregate large amounts of historical data, they provide a consistent reference point for investors to apply across multiple investment cycles.
How Investors Use VC Fund Performance Metrics
Investors rely on VC fund performance metrics such as internal rate of return, total value to paid in, and distributions to paid in. These measurements help investors evaluate strategy fit, risk, and long-term return potential. Metrics also offer a way to compare venture capital historical returns across different cycles. New investors can compare the numbers they see today with the best VC fund performance benchmarks by year to understand how funds typically behave over time.
These metrics form the foundation of most investment decisions in the venture capital world. Consistent interpretation helps investors build reasonable expectations about when capital returns may occur and what realistic growth looks like. Investors who understand these metrics can better evaluate both early-stage and later-stage strategies. This helps them compare performance claims, avoid common misunderstandings, and track whether their commitments are maturing as expected.
Comparing Top Quartile VC Fund Performance
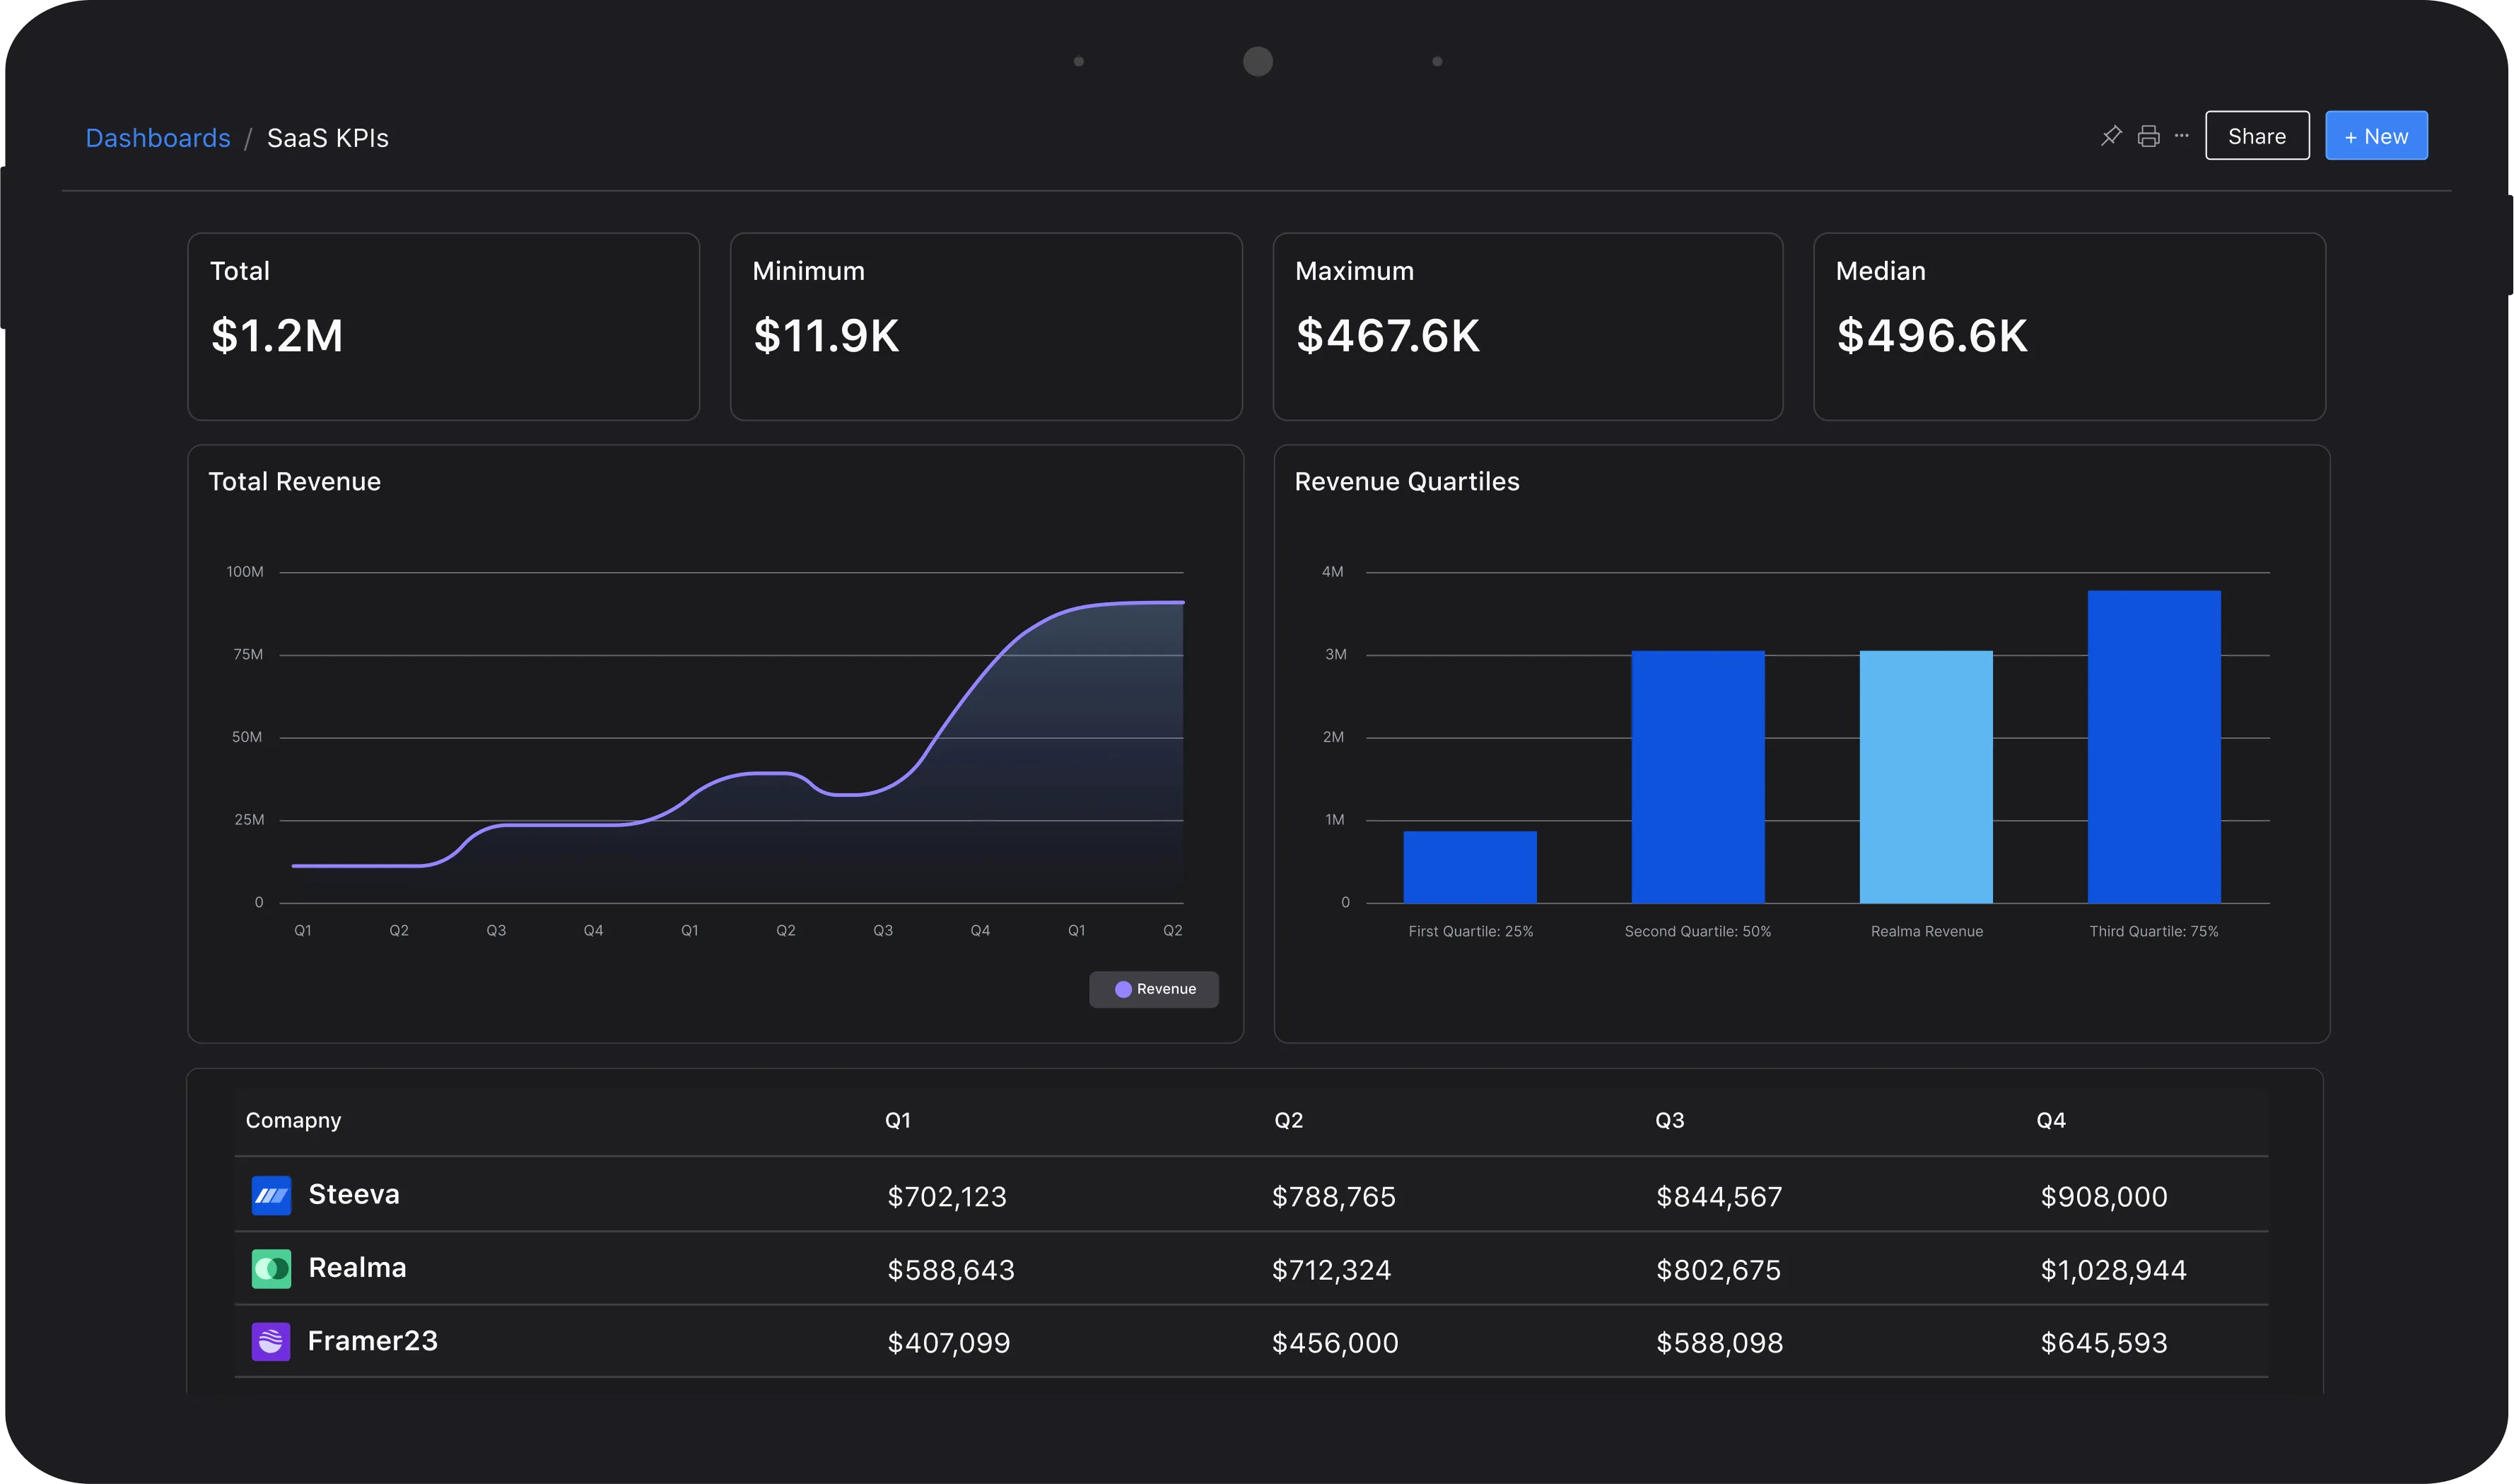
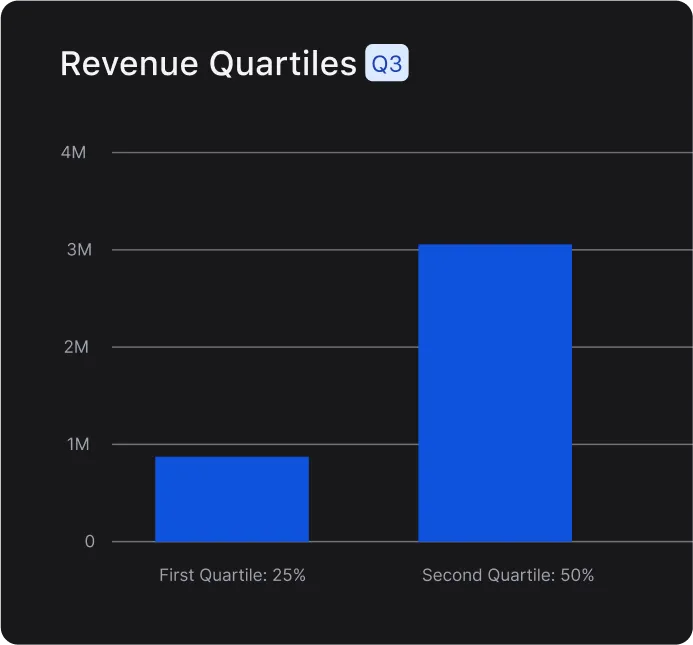
Top-quartile results often guide investors seeking to understand the upper end of possible outcomes. A top quartile VC fund performance chart helps illustrate how strong funds perform relative to the rest of the market. Investors pay attention to how top quartile VC fund performance shifts across cycles to understand where strong results tend to cluster. Consistent improvement or decline across years can help set expectations for new commitments.
Top quartile results provide a reference point for understanding the performance gap between high-achieving funds and the rest of the market. This spread is essential because venture capital returns often concentrate in a small segment of funds that consistently outperform. Investors who study top quartile patterns gain insight into how fund strategy, team experience, sector focus, and pacing influence long-term success. This can help them select managers with stronger track records and improved operational discipline.
Reviewing VC Fund Performance Benchmarks by Year
Vintage year analysis is one of the most common ways to interpret benchmark data. Investors look at how different years compare, how market cycles influence returns, and how pacing affects long-term outcomes. Benchmark resources often include a VC fund performance benchmarks by year graph and a VC fund performance benchmarks by year PDF to help readers visualize trends. These tools allow investors to study patterns and see how returns change as funds mature.
Vintage-year results help investors understand how external factors shape outcomes. For example, years with high valuations may lead to slower distribution cycles and lower early returns. Years with more conservative pricing may yield more substantial cash-on-cash returns later in a fund's life. Reviewing these patterns helps investors balance expectations during both strong and challenging market environments. It also helps them understand how long it may take for distributions to begin.
As investors become more familiar with vintage-year differences, they often learn to anticipate when fund returns may accelerate or slow. Mature funds that follow historical pacing trends offer helpful signals about how early performance aligns with benchmarks. This additional context can support better pacing decisions and help investors understand whether a fund is tracking toward long-term success.
Understanding U.S. Venture Capital Investment by Year
Long-term benchmarks become easier to understand when paired with market activity. U.S. venture capital investment by year influences valuations, deal volume, and exit timing. When investment activity increases or decreases, the shifts often appear later in fund performance benchmarks. Investors who track U.S. venture capital investment by year alongside vintage year data can better understand why returns rise or fall across cycles.
Investment volume acts as a signal of market sentiment. High investment levels may push valuations up, which can affect long-term performance. Lower investment levels often make it easier for funds to acquire ownership at attractive prices. These fluctuations help explain why certain vintage years outperform others. Understanding this connection helps investors set more realistic expectations about future results and identify periods that may present stronger opportunities.
Interpreting Long-Term Venture Capital Historical Returns
Historical venture capital returns provide a broad view of how the asset class has performed over time. These long-term results help investors understand patterns such as return persistence, volatility, and the impact of economic cycles. When investors compare venture capital historical returns with VC fund performance benchmarks, they can see how both short-term and long-term trends interact. This helps set expectations about what future results may look like.
Historical return patterns show that venture outcomes often depend on market timing, technological change, and shifts in competitive pressures. These patterns remind investors that short-term underperformance does not always signal long-term weakness and that some of the most successful funds experience delayed but meaningful value creation. Recognizing these dynamics helps investors avoid premature conclusions and maintain a balanced outlook.
How to Apply Benchmarks to Your Investment Strategy
Benchmarks serve as a guide for evaluating new opportunities and building a balanced strategy. Investors can compare a potential fund with the best VC fund performance benchmarks by year to understand how it fits within historical ranges. Reviewing VC fund performance metrics alongside top quartile data helps investors stay grounded in realistic expectations. Benchmarks do not predict outcomes, but they provide context for building a thoughtful approach.
Using benchmarks consistently helps investors evaluate manager performance, understand pacing, and identify outliers. These comparisons allow investors to see whether a fund is outperforming or lagging based on its maturity. Investors who combine these insights with their own risk preferences and objectives can build strategies that fit their long-term plans.
Where to Find and How to Review VC Benchmark Data
Investors access benchmark information from studies, index summaries, and historical charts. These resources often include details such as Cambridge Associates benchmarks, Cambridge Associates top quartile VC fund performance, Cambridge Associates top quartile VC fund performance by year, and Cambridge Associates' private equity index PDF. These materials help investors review consistent data sets when studying VC fund performance benchmarks. They also guide newcomers through the process of interpreting long-term trends.
Reviewing these resources helps investors build familiarity with the metrics that matter most. Over time, this familiarity improves the ability to analyze opportunities, identify standout performance, and avoid misleading comparisons. Investors who regularly consult benchmark data gain a stronger foundation for evaluating a broad set of managers, strategies, and stages.
Using Benchmarks to Support Confident Decisions
Benchmarks help investors understand how results vary across years and how market cycles shape outcomes. By reviewing VC fund performance benchmarks and comparing vintage year patterns, investors gain clarity on what strong performance looks like. Regular benchmark reviews help investors build confidence, evaluate opportunities with more precision, and make informed long-term decisions.
Frequently Asked Questions
What are VC fund performance benchmarks and why do they matter?
VC fund performance benchmarks show how venture funds perform across different vintage years and market cycles. They help investors compare results, understand the gap between average and top quartile performance, and set expectations for long-term returns. Benchmarks offer a consistent reference point for evaluating new and existing funds.
How is top quartile VC fund performance calculated?
Top quartile VC fund performance is calculated by ranking funds within a specific vintage year or strategy and identifying the top 25 percent based on metrics like internal rate of return and total value to paid in. This comparison helps investors understand how strong funds perform relative to the broader market.
Why do investors review VC fund performance benchmarks by year?
Investors review VC fund performance benchmarks by year to understand how economic cycles, valuations, and exit conditions influence returns. Vintage-year data highlights how different market environments affect outcomes and provides a clearer context for evaluating new commitments. This approach helps investors anchor expectations to historical patterns.
How do VC fund performance metrics help investors evaluate a fund?
VC fund performance metrics such as internal rate of return, total value to paid in, and distributions to paid in help investors measure a fund’s progress and long-term potential. These metrics reveal whether a fund is maturing at a healthy pace and allow for comparisons with venture capital historical returns and benchmarks.
What influences VC fund performance across different market cycles?
VC fund performance is shaped by shifts in valuations, deal volume, exit activity, and U.S. venture capital investment by year. Strong or weak market conditions appear later in performance benchmarks as funds mature. Understanding these patterns helps investors interpret results and identify strategies that perform well across varying environments.
How can investors use VC fund performance benchmarks when evaluating new funds?
Investors use VC fund performance benchmarks to compare a potential fund to historical return ranges. This helps gauge whether a manager’s targets are realistic, understand how similar strategies performed in past cycles, and identify potential opportunities or risks. Benchmarks provide helpful context for building a disciplined investment process.


