Trusted by Over 6,100 Founders
Enrich Your Investor Updates With Dynamic Charts
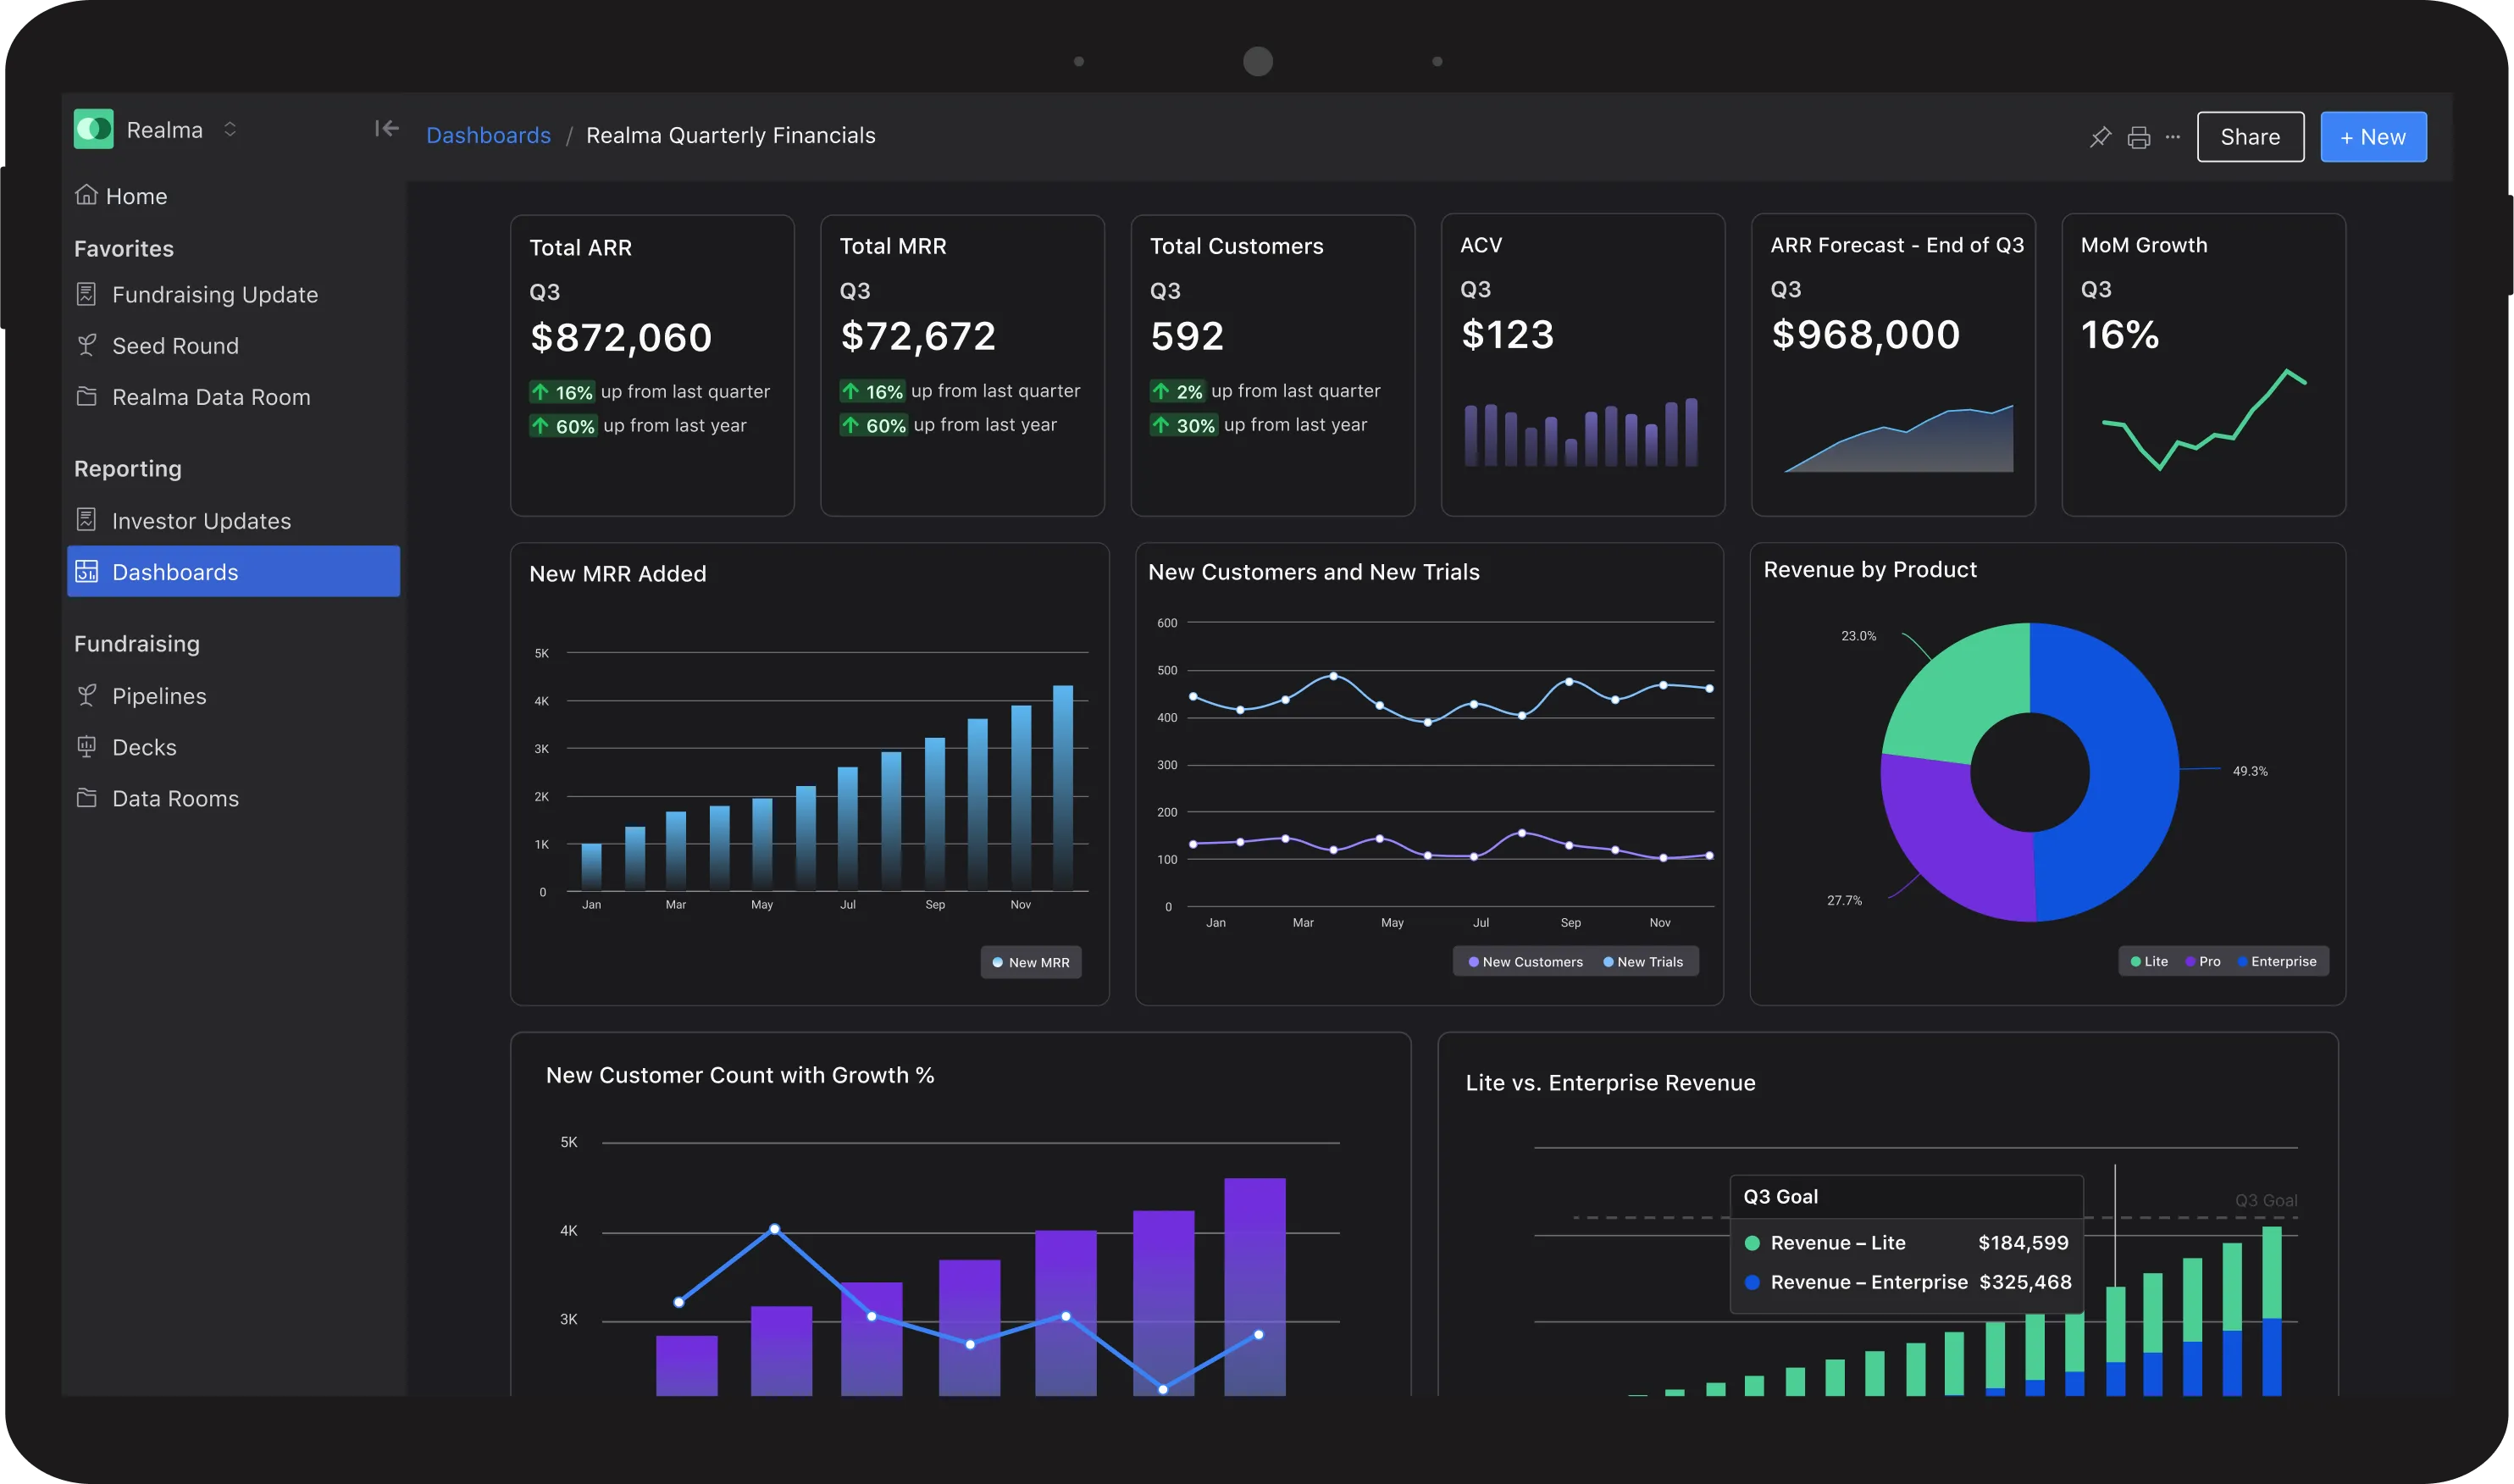
Import data, visualize KPIs, and strengthen your investor updates with consistent data and beautiful charts.

Flexible Charts, Tables, and Widgets
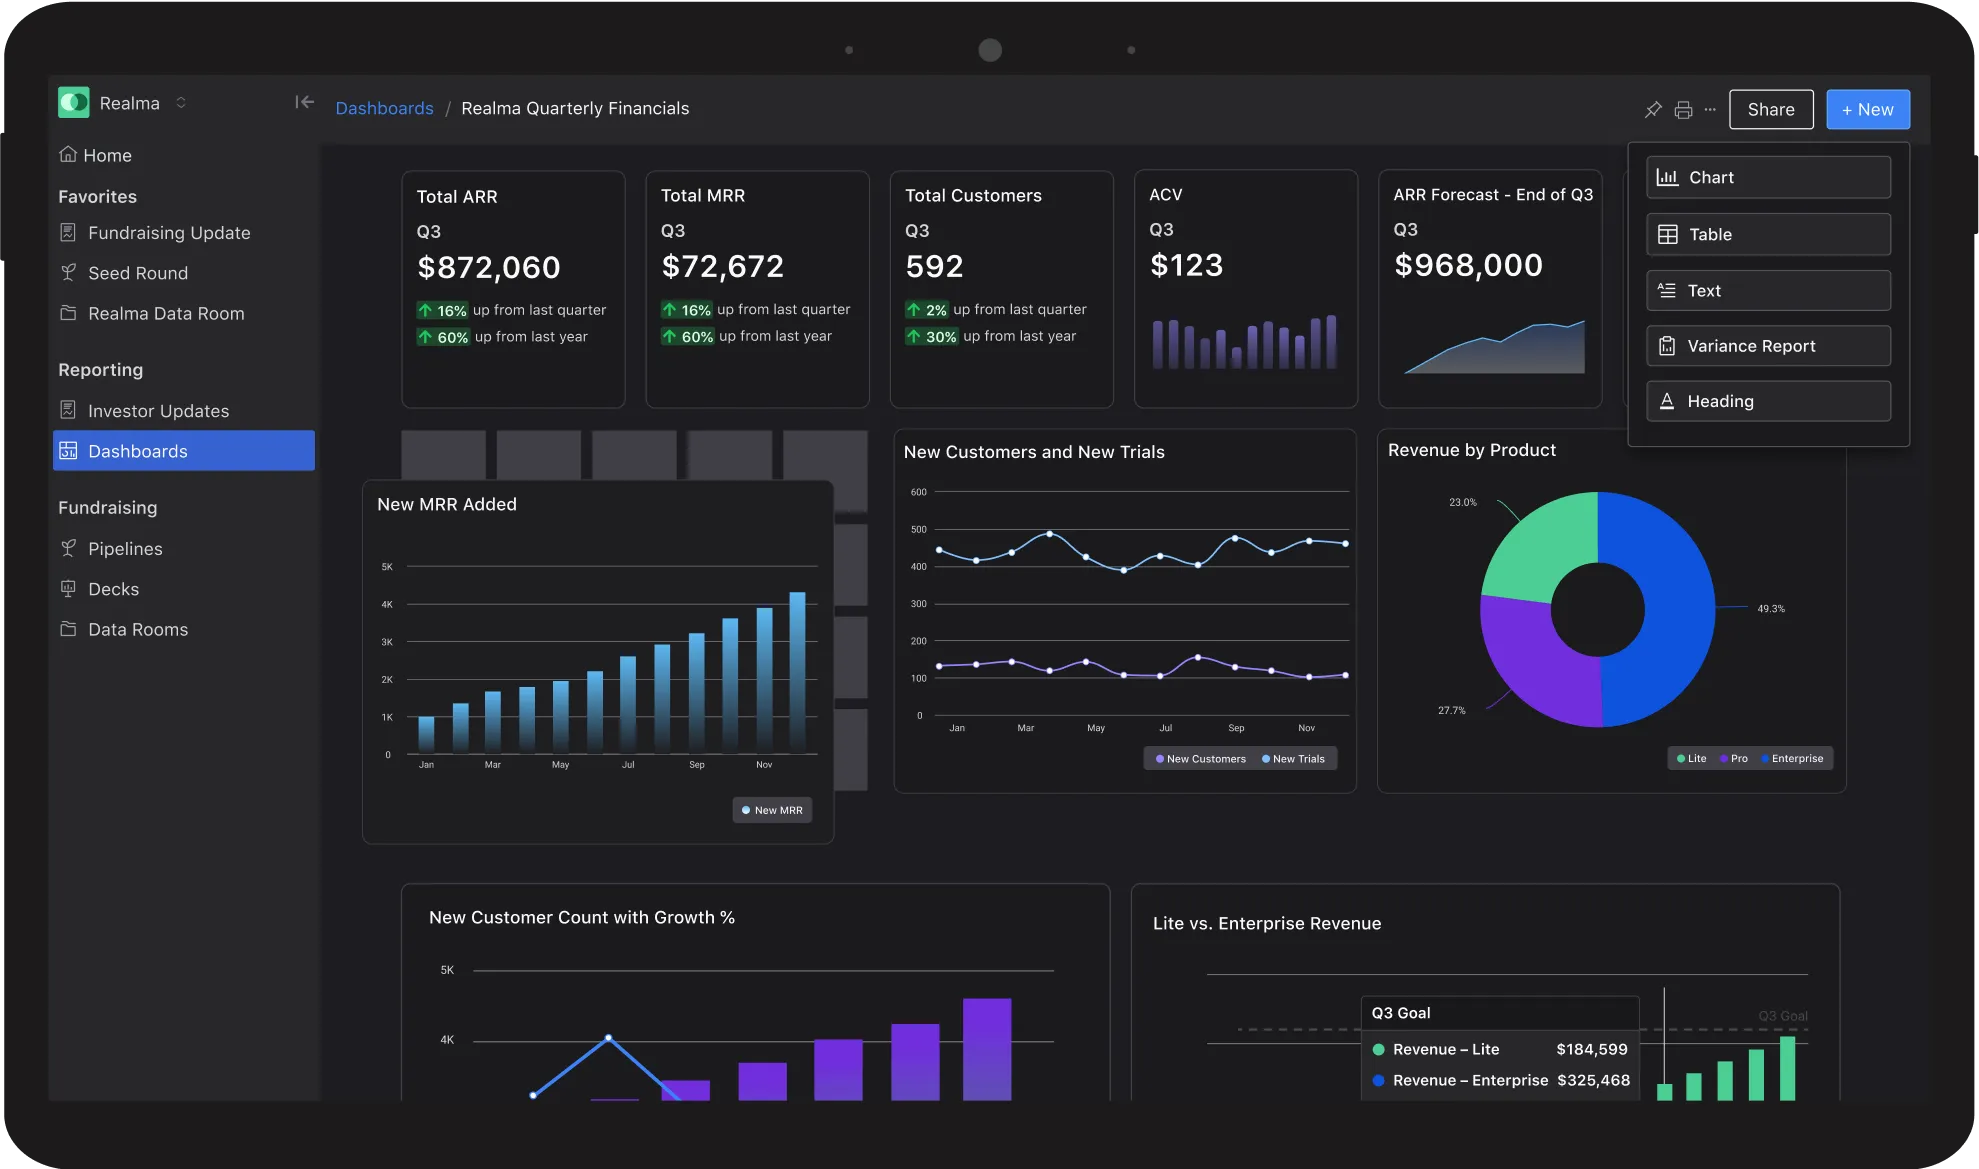
Our fully flexible dashboards allow you to combine flexible charts, tables, and widgets to give full context to your KPIs.
- Use our modern chart editor to visualize and customize KPIs
- Automatically calculate and display new insights alongside your data
- Add additional context with rich text widgets

Connect with Stakeholders
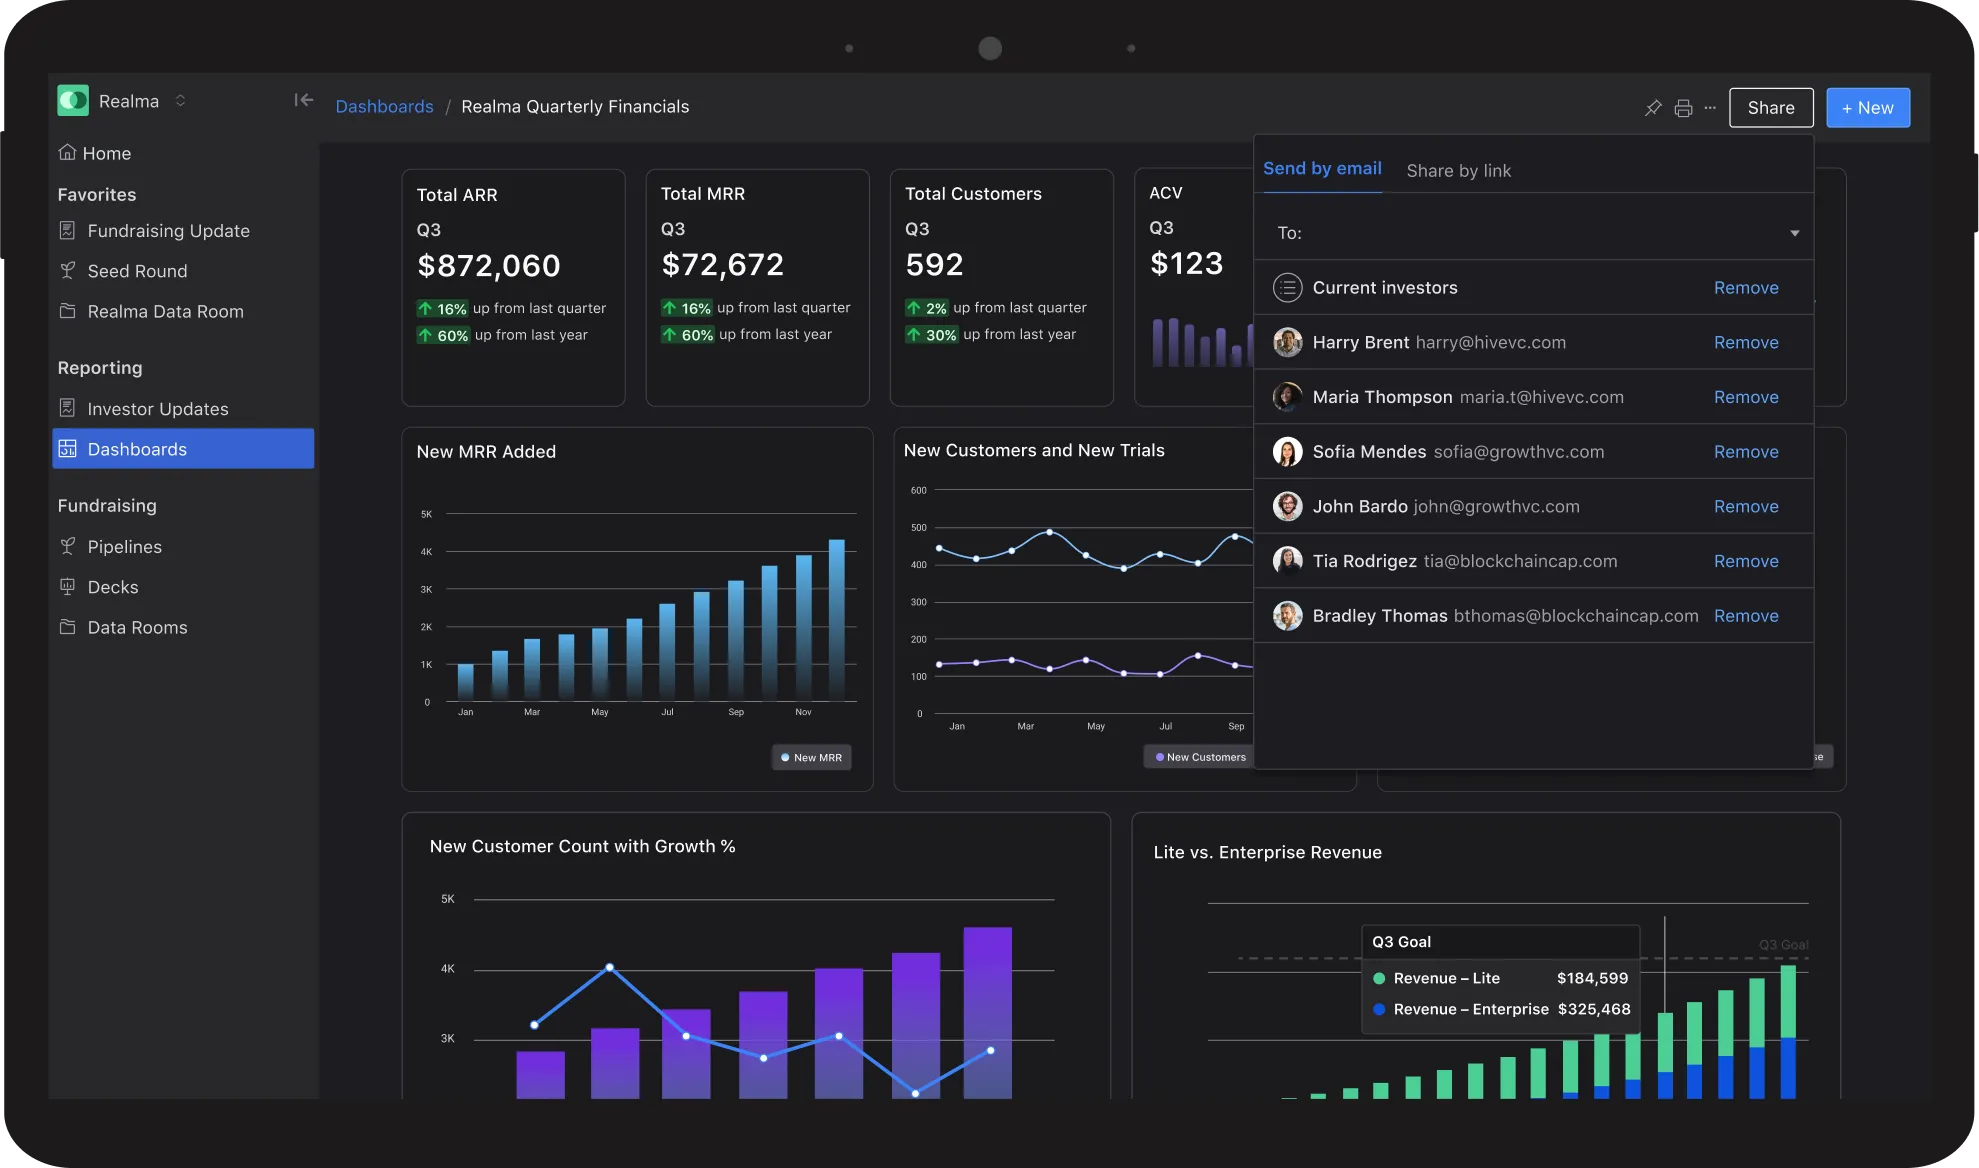
Make your dashboards actionable by sharing directly in Visible Updates, Data Rooms, and in your stakeholders’ workflows.
- Securely share dashboards via login or password protection
- Distribute dashboards via public link or embed
- Include dashboards and charts in Visible Data Rooms and Updates
Integrations
Visualize Your Key Metrics in Minutes With Our Easy-to-Use Chart Editor & Data Integrations
View All Integrations Trusted by Thousands of Founders
Manage Your Capital Raise From Deck to Check
Visible is your command center for your capital-raising efforts. Manage your capital raise from start to finish with our investor database, investor pipelines, data rooms, and pitch deck sharing.
Questions About Startup Metric Tracking
Check out some common questions and answers we regularly receive about metric tracking below:
What startup metrics should I track?
The metrics that your startup should track ultimately depends on your model, stage, and market. However, we see that most founders and investors track the following metrics — Cash on hand, burn rate, run rate, revenue, revenue growth, and engagement metrics. Learn more about the common metrics startups track.
What metrics should I include in an investor update?
The metrics included in your investor update is ultimately up to your business model and relationship with investors. Cash on hand, burn rate, run rate, revenue, revenue growth, and engagement metrics are a great place to start. What is most important is staying consistent with how and when you are sharing your metrics.
How can I automate startup metric tracking?
With Visible, you can connect to our direct integrations and chart your KPIs. Data will automatically be displayed on a nightly basis and you will be able to share it with key stakeholders via dashboard, update, and data room.
Enrich Your Investor Communication with Powerful Dashboards & Charts
Get Visible Free


