
Lisa Cawley, Managing Director at Screendoor, put the stakes plainly:
"You need to have these systems in place that are feeding you the data that you need, that are getting you information as fast as possible, because otherwise you're relying on stale information and you're going based on your gut."
The data most funds need already exists in their stack. The question isn't whether the data is there. It's whether it's connected and whether it's working together in the place where your team is already doing its best thinking.
Our MCP Server changes that. Connect your existing sources to your LLM, and benchmarking stops being a manual reconciliation exercise and starts being a conversation.
If You're Already Paying for the Best Data, You Should Be Using It Together
Most funds are already subscribed to best-in-class market data tools. The gap isn't the data. It's that it isn't connected to the portfolio data that gives it context.
As Justin Hilliard of Rebel Fund put it when talking about how his team approaches their data stack:
"Our philosophy on build versus buy is buy where we can. There are plenty of APIs out there that can help give you access to that, and I would strongly recommend that people lean into that."
MCP is how you act on that. If you're already using tools like PitchBook and Harmonic, connecting them to Visible in your LLM isn't adding something new to your stack. It's making what's already in your stack work the way it should.
Four Decisions That Get Better When Your Data Is Connected
Which portfolio companies are worth highlighting in your next LP report?
Prompt: "Pull ARR growth, gross margin, and net cash burn for all my portfolio companies from Visible over the last four quarters. Using PitchBook, pull the median ARR growth rate and gross margin for Series B SaaS companies that raised in the last 18 months in [sector]. Rank my portfolio companies against those market benchmarks and identify the top performers."
LP reports are only as compelling as the context behind the numbers. A company growing 40% looks different when you can show it's tracking in the top quartile of comparable companies raising right now. This prompt surfaces those stories before you have to go looking for them.
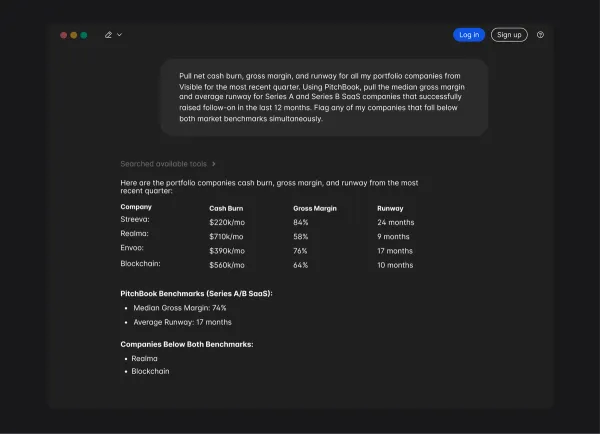
Which companies are at risk before they tell you?
Prompt: "Pull net cash burn, gross margin, and runway for all my portfolio companies from Visible for the most recent quarter. Using PitchBook, pull the median gross margin and average runway for Series A and Series B SaaS companies that successfully raised follow-on in the last 12 months. Flag any of my companies that fall below both market benchmarks simultaneously."
Internal data tells you a company is burning fast. External data tells you whether that burn rate is disqualifying in the current fundraising environment. That's a more actionable answer, and one worth having before a portfolio review, not during it.
Is this portfolio company ready for a follow-on conversation?
Prompt: "Pull ARR growth, gross margin, and net cash burn for [Company] from Visible over the last four quarters. Using PitchBook, pull the median metrics at time of raise for Series B SaaS companies in [sector] that closed a round in the last 12 months. Is [Company] tracking at or above market benchmarks for a fund at this stage, and how does it compare to the portfolio companies we've already supported through a follow-on?"
Follow-on decisions are some of the most consequential a fund makes, and some of the hardest to separate from pattern-matching and instinct. This prompt grounds the conversation in what the market has rewarded at this stage alongside your own portfolio history. When the answer comes back in seconds, the conversation moves from whether the data supports it to what you want to do about it.
Does this new deal match the profile of your best performers?
Prompt: "I'm evaluating a Series A SaaS company with $2.1M ARR, 18% QoQ growth, and 14 months of runway. Pull PitchBook comps for Series A SaaS companies in [sector] that raised in the last 12 months, median ARR, growth rate, and runway at time of raise. Then pull the metrics for my top-performing Visible portfolio companies at a comparable stage. How does this deal compare to both the market and the companies that have performed best in my portfolio?"
VCs invest in outliers. The goal isn't to find companies that match the median, it's to find companies that clear it in the ways that have historically predicted your best outcomes. Comparing a new deal against your own top performers, alongside current market data, is the framing that separates pattern recognition from gut feel.
Start With Your Own Portfolio
Before layering in external data, Visible's MCP lets you benchmark your portfolio companies against each other. Rank by ARR growth, flag capital efficiency risks, compare cohorts, and identify which companies are outperforming their own historical trajectory. That internal benchmarking is the foundation on which everything else builds.
For a full walkthrough of what's possible with Visible's MCP alone, including sample prompts for ranking portfolio performance, identifying underperformers, and evaluating new deals against your own history, watch our video here.
Your Portfolio Data Is Already There. MCP Is How You Unlock It.
Visible's MCP connects that data directly to your LLM, making it queryable alongside whatever external sources your team already uses and trusts.
The data you need to benchmark more effectively, identify risks earlier, and make more confident follow-on decisions is already in your stack. MCP is what puts it to work.
Request a demo below to see it in action.