Use Variance Reports to Determine How You’re Tracking to Your Projections
How are we doing? Are things going to plan? Are we overspending? Underspending? Where should we double-down? Cutback?
These are all questions that you’ve likely encountered in a management meeting or recent board meeting.
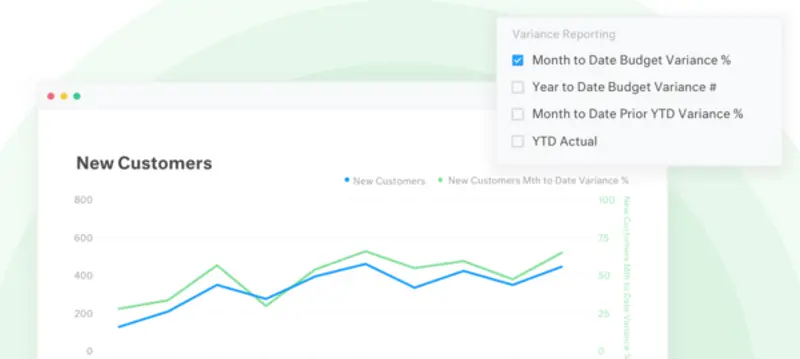
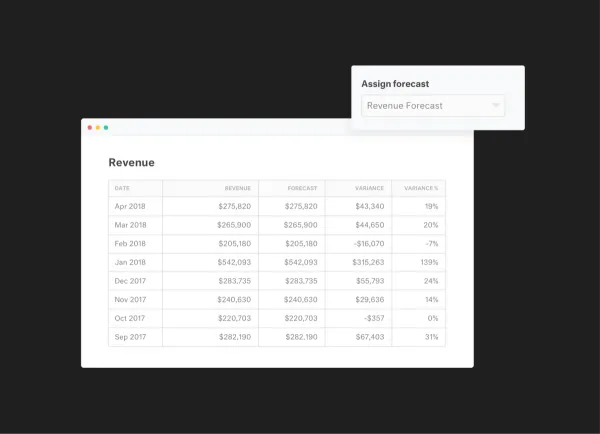
Today we are excited to announce new Variance Report module that will be part of our insights layer. Variance reporting will let our customers quickly assign any of their KPIs to a forecasted or budgeted value and with one-click get back a full Variance Report.

We’ll calculate the following in your Variance Report:
- MTD Variance
- MTD Variance %
- YTD Actual
- YTD Variance
- YTD Variance %
- YTD Actual
- prior yr YTD Actual
- prior yr YTD Variance
- prior yr YTD Variance %

Our budget vs actual and variance reporting will give you instant insights and reporting capabilities for any of your metrics in Visible. Being able to make timely decisions based on your forecasts and budget will help accelerate growth, manage your bottom line and hit goals across your organization. Utilizing the variance report in Visible is great for:
- Weekly team updates showing progess towards your Monthly and Annual Goals
- Crafting monthly management reports to your leadership teams providing feedback on where you under/over performed
- Creating pre-board meeting reports that give a health check on where you are compared to board approved budgets.
We hope you enjoy! Sign in to Visible to get started to or sign up! Feel free to email support@visible.vc with any questions, comments and feedback.
Up & to the right, The Visible Team


