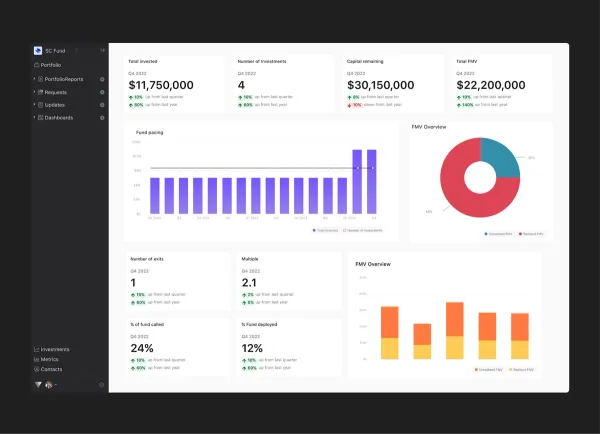
Fund performance dashboard templates are here
Fund performance dashboard templates empower investors to build a best practice investment overview dashboard in 2-clicks and easily share it with stakeholders or team members.

How it works
Ensure your investment data is up to date in Visible and then select which fund data you want to visualize. Visible automatically creates a dashboard based on best practices. The dashboard includes key fund data and insights that help investors understand and communicate how their fund is performing. From there, the user can customize the dashboard by adding or removing widgets, changing the layout, changing colors, adding commentary and more.
The dashboard can then be duplicated and applied to different funds.

Fund metrics supported in Visible
Visible supports over 25 fund metrics and calculated insights including:
- Total invested
- Average investment amount
- Total number of investments
- Number of exits
- Capital remaining
- Follow on capital deployed
- Gross IRR
- Net IRR
- Multiple
- Total capital called
- New capital deployed
- % of fund called
- Realized FMV
- RVPI
- TVPI
- DPI
- Management fees
- Capital called
- Escrow
- Expenses
- Carried interest
- Distributions
- and more
Learn more about the key fund metrics and calculated insights supported in Visible here.


