


Key Takeaways
-
The foundation of LP trust: High-quality LP reporting is more than a fiduciary duty; it is a critical driver of capital retention and successful subsequent fundraising for venture capital firms.
-
Essential report components: A best-in-class investor report balances macro fund performance metrics (IRR, DPI, TVPI) with granular portfolio updates and individualized capital statements (PCAPs).
-
Standardized workflows win: Establishing a predictable, step-by-step reporting process ensures LPs receive accurate, timely data while minimizing internal back-office chaos.
-
The limits of legacy templates: Relying on static Excel models and PDF reporting templates creates manual bottlenecks that eventually break as your LP base and portfolio scale.
-
The shift to modern software: Upgrading to centralized, automated reporting dashboards provides LPs with secure, real-time insights while saving your finance team hundreds of hours each quarter.
What Is LP Reporting?
LP reporting is the formal process where General Partners (GPs) share financial performance, portfolio updates, and fund activity with their Limited Partners. An LP report typically includes core fund metrics, capital account statements, and narrative commentary to keep investors accurately informed about their capital.
For venture capital firms, private equity funds, and emerging managers, high-quality reporting is more than a fiduciary duty—it is a critical pillar of investor relations. Effective LP reporting builds trust, demonstrates operational excellence, and drives capital retention. Ultimately, the quality of your LP communication directly impacts your ability to raise subsequent funds successfully.
However, managing growing LP expectations while relying on fragmented data, manual workflows, and static PDFs often strains time-constrained fund managers.
In this guide, we will break down the anatomy of a best-in-class investor report. You will learn exactly what metrics to include, explore actionable reporting examples and templates, and discover how modern funds are upgrading their workflows to build scalable, automated reporting systems.
What Should Be Included in an LP Report
What should be included in a quarterly report?
A standard quarterly LP report should include a high-level executive summary, core fund performance metrics (like IRR and TVPI), detailed portfolio company updates, recent capital activity including calls and distributions, and standardized financial statements to provide a complete picture of the fund’s health.
What are the three main objectives of financial reporting?
The three main objectives of financial reporting in venture capital are to provide accurate information for LP investment decision-making, demonstrate transparency regarding fund cash flows and capital balances, and ensure compliance with fiduciary duties and established industry standards.
Beyond the baseline requirements, the best investor reports synthesize raw data into a clear, actionable narrative. Pulling this data from fragmented spreadsheets can be painful, but standardizing these core components is essential for a high-performing report:
Fund Performance Metrics
LPs evaluate your fund against their broader portfolio and alternative asset benchmarks. They do not just want to see arbitrary valuations; they want to understand the velocity and efficiency of their capital. Always include:
- Internal Rate of Return (IRR): Both gross and net IRR to show annualized, time-weighted growth.
- Multiple on Invested Capital (MOIC): The overall value generated relative to the initial capital invested.
- Distributions to Paid-In Capital (DPI): The realized cash returns sent back to LPs, arguably the most scrutinized metric in a liquidity-constrained market.
- Total Value to Paid-In Capital (TVPI): The sum of realized and unrealized value.
Portfolio Company Updates
Investors want to know exactly what is driving the fund's performance. Avoid simply dumping raw startup metrics without context. Instead, categorize your portfolio (e.g., top performers, steady growth, at-risk) and provide structured updates for key assets:
- Milestones and Highlights: Major product launches, key executive hires, or significant revenue growth.
- Risks and Headwinds: Transparent acknowledgment of challenges (e.g., missed targets, short runway) and how the GP is actively assisting the founders.
- Subsequent Funding: New rounds raised, lead investors, and valuation step-ups (or down rounds).
Capital Activity
LPs must manage their own liquidity, treasury, and cash flow planning. Providing clear visibility into capital movement is essential for maintaining a frictionless relationship.
- Capital Calls: Historical drawdowns and accurate forecasts for upcoming capital requests.
- Distributions: Details on recent liquidity events, exits, or dividends distributed back to the LP base.
- Unfunded Commitments: The exact remaining capital LPs are obligated to deploy.
Financial Statements
While narrative updates provide the necessary context, financial statements provide the objective truth. Depending on the LP's specific requirements, provide a balance of high-level summaries and detailed schedules:
- Schedule of Investments (SOI): A line-by-line breakdown of every asset, its original cost basis, and its current fair market value.
- Balance Sheet & Income Statement: Standard fund accounting financials.
- Partner Capital Account Statements (PCAPs): Individualized statements showing each specific LP's precise share of the fund's assets, liabilities, and capital accounts.
Market Commentary
The best GPs act as a specialized lens through which LPs view the broader venture market. Use your investor report to provide contextual insights:
- Macro Environment: How interest rates, regulatory changes, or sector-specific trends are impacting your investment thesis.
- Deal Flow Dynamics: Insights into your current pipeline, founder valuation expectations, and competition for allocations.
- Strategic Narrative: How the fund is actively adapting its deployment strategy based on real-time market conditions.
LP Reporting Examples (What a Strong Report Looks Like)
The difference between a good investor report and a great one lies in the structure. LPs review dozens, sometimes hundreds, of updates every quarter. If your data is buried on page 14 of a dense PDF, it loses its impact.
A strong LP reporting example clearly separates high-level takeaways from granular financial data, allowing the reader to consume the information at their preferred depth. Below is a breakdown of what a best-in-class structure actually looks like in practice.
Example Quarterly LP Report Structure
When structuring your quarterly update, flow from the macro (fund-level) to the micro (company-level). A highly effective standard structure looks like this:
- Section 1: Executive Summary & GP Narrative: A one-page memo summarizing the quarter. Did the fund deploy capital? Were there any exits or markdowns? How is the GP navigating current market conditions?
- Section 2: Fund Performance Snapshot: A clean, visual table highlighting core metrics side-by-side: Gross/Net IRR, TVPI, DPI, RVPI, Total Capital Called, and Total Capital Distributed.
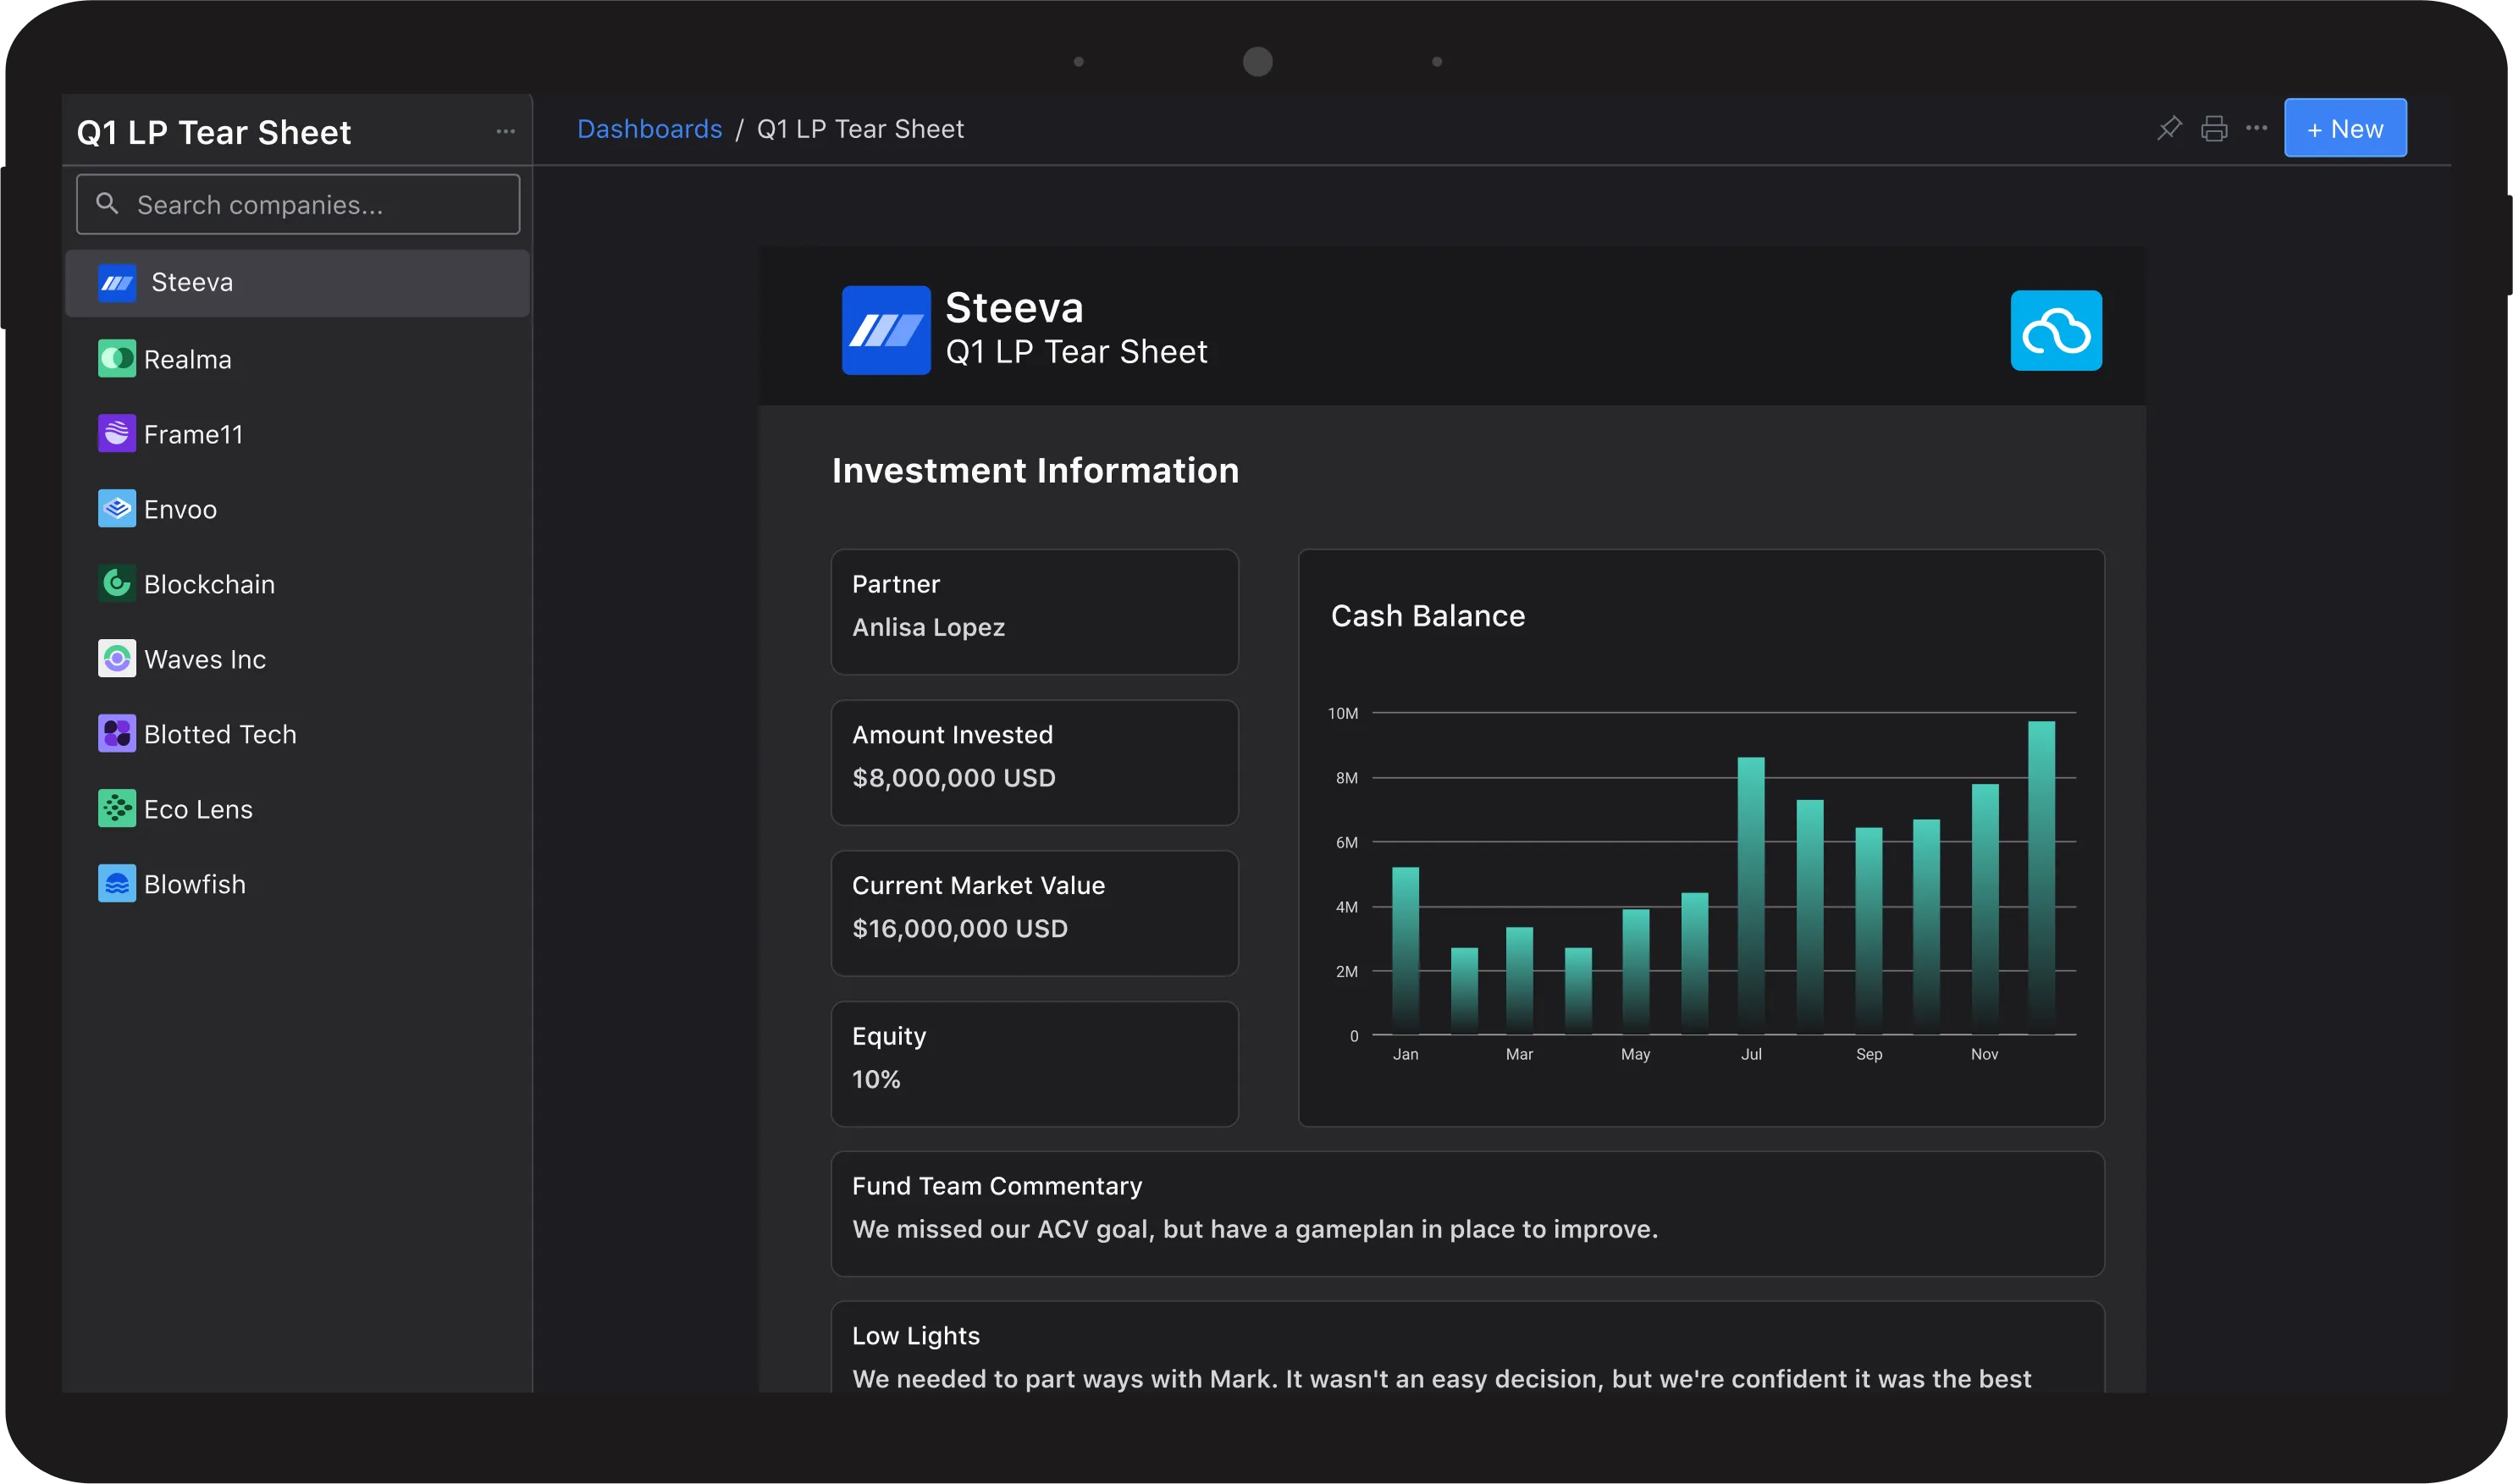
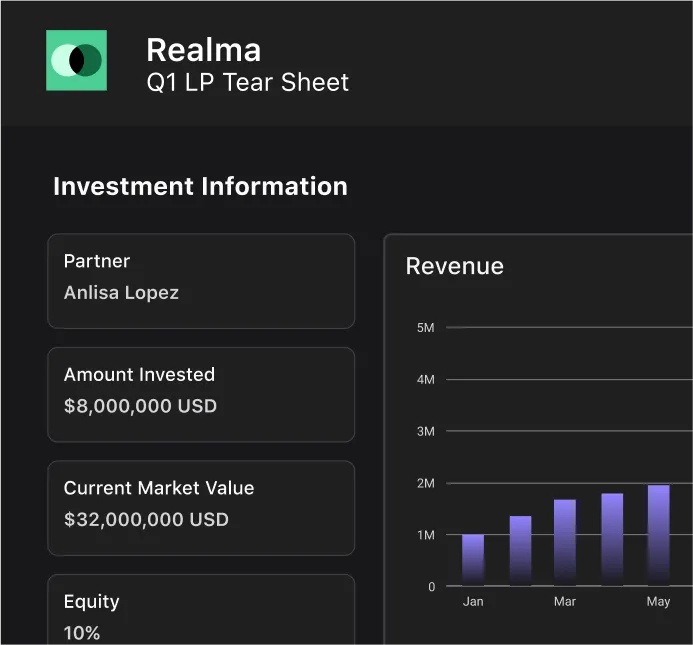
- Section 3: Portfolio Highlights (The "Tearsheets"): Detailed, one-page overviews for the top 3–5 portfolio companies driving the fund's returns. This includes their specific revenue metrics, cash runway, recent milestones, and how the GP is currently supporting them.
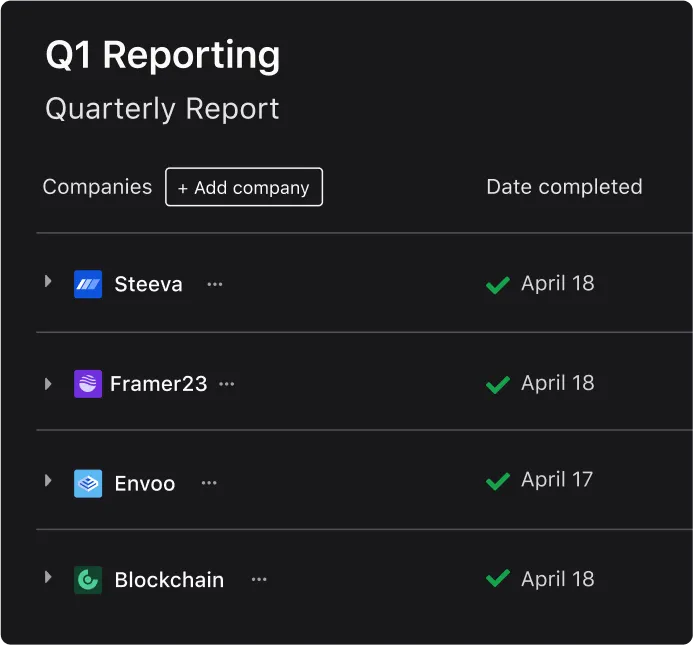
- Section 4: General Portfolio Updates: A streamlined table or grid covering the rest of the active portfolio, noting their current valuation, recent funding rounds, and a brief one-sentence status update (e.g., "Performing to plan," "Cash constrained").
- Section 5: Capital Account Statements (PCAPs): The individualized financial schedules detailing the specific LP’s ending capital balance and ownership percentage.
LP Reporting Templates (Excel, PDF, and Modern Alternatives)
When fund managers search for an investor report template, they are typically looking for a standardized, repeatable format that minimizes administrative work at the end of every quarter. The underlying format of your lp reporting template dictates not just how your LPs consume the data, but how many hours your team spends building it.
Historically, the industry has relied heavily on spreadsheets and document editors. However, as fund sizes grow and LP bases diversify, the limitations of manual formats become obvious. Here is a breakdown of the standard template formats and how they compare.
Excel-Based Templates
An lp reporting template excel file is the traditional starting point for most emerging managers and smaller funds.
- The Pros: Complete flexibility. You can build custom formulas for complex waterfall distributions, bespoke fee calculations, and unique performance hurdles. Almost every finance professional is comfortable manipulating data in this environment.
- The Cons: Spreadsheets do not scale. Version control becomes a significant liability when multiple team members are updating valuations, capital accounts, and cap tables simultaneously. Relying on manual data entry across disparate tabs increases the risk of critical reporting errors. Finally, sending raw spreadsheets lacks the professional polish that institutional LPs expect.
PDF Reports
To solve the formatting issues of spreadsheets, most funds transition their data into an lp reporting template pdf for final distribution.
- The Pros: A finalized lp reporting pdf provides a static, secure snapshot in time. It prevents accidental data manipulation by the receiver, preserves exact formatting across different devices, and allows for clean, branded presentation of the GP's narrative.
- The Cons: PDFs are a dead end for data. If an institutional LP wants to run their own analysis on your fund's TVPI progression over the last four quarters, they are forced to manually extract the data from your PDF back into their own internal systems. Furthermore, generating these files often requires manually copy-pasting charts and narratives from Excel and Word into a design tool, creating a massive operational bottleneck every reporting cycle.
Modern Dashboard-Based Reporting
Sophisticated GPs are increasingly moving away from static files toward centralized, software-driven reporting environments.
- The Pros: Modern dashboards connect directly to your underlying portfolio data. Instead of manually updating a static template, a centralized system automatically pulls the latest metrics, standardizes the formatting, and generates dynamic reports. LPs can log into a secure portal where they can view high-level summaries or drill down into the underlying company data on demand.
- The Cons: Moving to a modern system requires an initial operational shift to migrate historical data from legacy spreadsheets into a centralized database.
Conceptual Template Framework Regardless of the medium you choose, any robust investor report template must systematically organize data into three core pillars:
- Fund-Level Rollup: Macro metrics (IRR, MOIC, DPI), total called capital, and total distributions.
- Asset-Level Ledgers: Line-by-line Schedule of Investments (SOI) tracking initial cost, current fair value, and ownership percentage per company.
- LP-Level Statements: Individualized PCAPs detailing the specific investor's starting balance, current quarter activity, and ending capital account balance.
How to Create an LP Report (Step-by-Step Process)
What are the 5 steps of financial reporting? The 5 steps of financial reporting for venture capital funds include: 1) collecting raw portfolio and financial data, 2) standardizing metrics across all investments, 3) analyzing overall fund and portfolio performance, 4) building the structured LP report, and 5) securely distributing the final report and communicating insights to investors.
If you are wondering how to write an investment portfolio report that scales as your fund grows, the secret lies in your workflow. A strong reporting process moves predictably from raw data collection to actionable insights and, finally, to seamless delivery.
Here is the step-by-step process for executing a flawless reporting cycle:
Step 1: Collect Portfolio and Financial Data
Before you can write a single sentence of commentary, you need accurate data. This involves two distinct streams:
- Portfolio Company Data: Requesting quarterly updates from your founders, including financial KPIs (ARR, cash balance, burn rate), qualitative milestones, and updated cap tables.
- Fund Accounting Data: Reconciling bank statements, tracking recent capital calls or distributions, and updating the fund’s balance sheet. Note: Relying on email threads to chase founders for data is the biggest bottleneck in this step. Standardizing how you request and receive this data is critical for efficiency.
Step 2: Standardize Metrics Across Investments
Raw data is rarely uniform. One founder might report GAAP revenue while another reports contracted ARR. To present a cohesive portfolio view to your LPs, you must standardize these metrics. Normalize the data into a consistent format so that KPIs, valuation methodologies, and performance categories mean the exact same thing across your entire portfolio.
Step 3: Analyze Fund and Portfolio Performance
With standardized data in hand, transition from data gathering to analysis. Roll up the individual asset values to calculate your fund-level metrics.
- Calculate gross and net IRR, MOIC, DPI, and TVPI.
- Determine any necessary markups or markdowns based on recent funding rounds or impaired performance.
- Identify the key narratives of the quarter: Which companies are driving outsized returns? Which ones require strategic intervention?
Step 4: Build the LP Report
Next, synthesize your analysis into the actual report structure. This is where you combine the quantitative data with your qualitative GP narrative. Draft the executive summary, build the individual company tearsheets, and generate the individualized Partner Capital Account Statements (PCAPs) for each LP. If you are using a modern reporting system, this step shifts from manual copy-pasting to simply reviewing auto-generated dashboards and adding your contextual market commentary.
Step 5: Distribute and Communicate with LPs
The final step is delivery. Security and accessibility are paramount here. Avoid sending sensitive financial data as unsecured email attachments. Instead, distribute the report via a secure investor portal or data room. Send a concise, high-signal summary email (as outlined in the previous section) that highlights the most critical updates and provides a direct, secure link for LPs to access their individualized documents and the broader fund performance dashboard.
LP vs GP Reporting: Roles, Expectations, and Differences
What is the difference between LP and GP approach?
The main difference between the LP and GP approach is their role in the fund. General Partners (GPs) actively manage the portfolio, make investment decisions, and generate reports on fund performance. Limited Partners (LPs) provide the capital, passively monitor their investments, and consume GP reports to evaluate risk and returns.
To understand effective investor communication, it is crucial to separate the two distinct reporting motions that occur within venture capital: the data GPs collect from founders, and the data GPs report to LPs.
The GP Role (The Aggregator and Manager)
General Partners are operators and capital deployers. Their internal reporting approach requires collecting granular, operational metrics directly from portfolio companies—such as monthly cash burn, gross margins, and hiring updates. The GP's job is to synthesize this raw, fragmented startup data, apply valuation methodologies, and translate it into a cohesive financial narrative.
The LP Role (The Allocator and Evaluator)
Limited Partners (such as endowments, family offices, and fund of funds) manage broad portfolios across multiple asset classes. They rarely want to see a startup's daily active user count or marketing CAC. Instead, their approach to reporting is strictly analytical and financial. They expect GPs to distill portfolio-level milestones into fund-level impact.
How Expectations Differ
Ultimately, GPs use data as leading indicators to help founders survive, grow, and execute. LPs use data as lagging indicators to evaluate the GP’s performance, report back to their own investment boards, and decide whether to commit capital to the GP's next fund. If a GP simply passes along raw founder updates without contextualizing how it impacts the fund's MOIC or IRR, they are failing to meet the core expectations of their LPs.
ILPA Reporting Standards Explained
What is ILPA reporting in private equity?
ILPA reporting in private equity refers to the practice of adopting the Institutional Limited Partners Association's standardized guidelines for fund disclosures. This includes using uniform fee reporting templates and capital call formats to promote transparency, align GP-LP interests, and streamline the data collection process for institutional investors.
What is the ILPA template?
The ILPA template is a standardized reporting framework created by the Institutional Limited Partners Association. It provides a uniform format for GPs to report capital calls, distributions, and capital account balances, ensuring LPs receive consistent, transparent, and easily digestible financial data across their entire portfolio.
Before ILPA introduced its reporting best practices, institutional LPs faced a massive data reconciliation problem. If a university endowment invested in 50 different venture capital and private equity funds, they received 50 completely different spreadsheet formats. This lack of uniformity made it nearly impossible for LPs to accurately track aggregate fee structures, compare net performance, or manage their own internal accounting.
ILPA standards create a common financial language. By adopting these frameworks, GPs signal institutional readiness and operational maturity. It removes the friction from the GP-LP relationship by providing data exactly how the LP's back-office needs to consume it.
How Funds Use ILPA Templates
While the ILPA guidelines are highly effective for standardizing financial data, the templates themselves are inherently complex. Managing the dense, multi-tab ILPA Excel models manually can drain hundreds of hours from a fund’s finance team each quarter.
Because of this, modern funds use the ILPA structure as a baseline for their data formatting but rarely rely on the raw spreadsheet alone. Instead, they increasingly utilize software platforms to automatically map their fund accounting data directly into ILPA-compliant formats. This ensures strict compliance with institutional standards without the crushing manual overhead.
LP Reporting Best Practices
Even with the right templates and a solid step-by-step process, the underlying principles of your communication dictate how LPs perceive your fund's management. To build enduring investor trust and align with the highest industry standards, integrate these core best practices into every reporting cycle.
Prioritize Transparency and Clarity
Trust is built during downturns, not just bull markets. If a high-profile portfolio company misses revenue targets, executes a down round, or shuts down entirely, do not bury the news at the bottom of the report. Address challenges head-on in your executive summary. Explain the root cause of the issue, outline how the GP is actively assisting the founders in mitigating risk, and clearly articulate the impact on the fund's overall returns. Radical transparency earns long-term LP loyalty.
Maintain Consistency Across Reports
LPs model your fund’s performance over years, not just quarters. If you constantly change your reporting format, shift valuation methodologies, or swap out which KPIs you highlight based on what looks best at the time, LPs will immediately flag your data as unreliable. Pick a standardized framework for calculating metrics (like net IRR and TVPI) and stick to it strictly. If a structural change to your reporting is absolutely necessary, clearly disclose the change and the reasoning behind it in your GP commentary.
Focus on Metrics That Matter to LPs
Resist the urge to over-report on vanity startup metrics. While your founders might be excited about a surge in free trial signups or aggregate portfolio headcount, your LPs are fundamentally evaluating capital efficiency. Keep the spotlight on the numbers that drive fund economics: Gross and Net IRR, MOIC, DPI, and the velocity of distributions. Qualitative updates should always contextualize how a company's progress will ultimately translate into liquidity for the LP.
Use Visuals to Improve Understanding
Institutional LPs review mountains of financial data every quarter. Dense blocks of text and endless spreadsheet rows create cognitive fatigue. Use clear, high-contrast data visualizations to tell the story faster.
- Use waterfall charts to illustrate capital distributions and fee structures.
- Use trend lines to show TVPI growth across consecutive quarters.
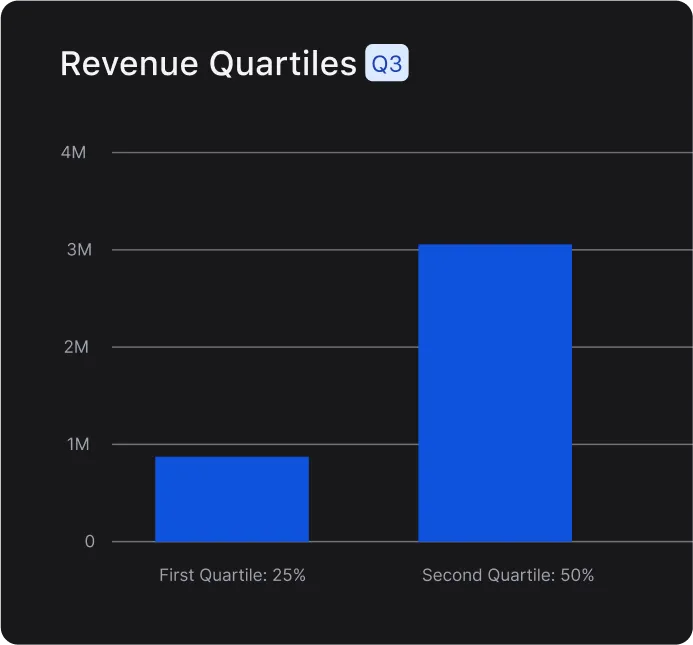
- Use stacked bar charts to visually represent portfolio diversification by sector or geography.
Keep Reporting Timely and Predictable
Operational excellence is signaled through punctuality. Establish a strict reporting calendar and communicate it to your LPs during the onboarding process. The industry standard is to deliver quarterly reports within 30 to 45 days of the quarter's end, and annual reports within 60 to 90 days. Treat these deadlines as unbreakable. Consistently missing reporting deadlines suggests to LPs that your back-office operations are chaotic, which can negatively impact future fundraising efforts.
Common LP Reporting Challenges (and How to Solve Them)
Even when General Partners understand what LPs want, the actual execution of delivering those insights is notoriously painful. For most venture capital finance and investor relations teams, the weeks following the end of a quarter are a chaotic sprint of data chasing and formatting.
Understanding these common bottlenecks, and implementing the right systems to bypass them, is the key to turning LP reporting from a reactive chore into a strategic advantage.
Manual Reporting Is Time-Consuming
The Problem: The traditional reporting workflow relies heavily on manual data entry. Analysts spend weeks copy-pasting updated valuations from cap table software, pulling expenses from accounting systems into Excel, and then transferring those charts into Word or InDesign to create a polished PDF. This manual process is not only slow but highly susceptible to keystroke errors.
The Solution: Transition from manual data entry to automated data pipelining. By using reporting software that integrates directly with your underlying data sources, you can auto-populate core financial metrics and focus your team’s time on writing the high-value qualitative narrative.
Data Is Fragmented Across Systems
The Problem: A fund’s operational truth rarely lives in one place. Portfolio company updates are buried in email threads or Notion pages. Bank transactions live in an ERP. Valuations sit in customized spreadsheets. When it is time to build the quarterly report, reconciling this fragmented data into a single, cohesive narrative is a logistical nightmare.
The Solution: Implement a centralized portfolio monitoring system. Before you can report effectively to LPs, you must have a single source of truth for your internal data. Centralizing your founder updates and fund metrics into one platform ensures that your reporting is always based on the most accurate, up-to-date information.
Reports Don’t Scale with Fund Growth
The Problem: A manual Excel-to-PDF workflow might be manageable for Fund I with 15 Limited Partners and 10 portfolio companies. However, by Fund III, you may be managing over 100 LPs and 40 active assets. Generating 100 individualized Capital Account Statements (PCAPs), watermarking them, and securely emailing them one by one creates a massive operational bottleneck that breaks under pressure.
The Solution: Adopt scalable distribution tools. Modern reporting systems allow GPs to generate individualized LP statements in bulk and distribute them simultaneously via secure, permission-based investor portals, entirely eliminating the friction of manual email distribution.
Lack of Standardization
The Problem: Without a strict process, GPs often fall into the trap of accepting whatever data formats their founders provide. One founder sends a highly detailed SaaS cohort analysis, while another sends a three-bullet-point email. When this unstructured data hits the GP's desk, it requires heavy manipulation before it can be presented uniformly to LPs. Furthermore, some institutional LPs may request bespoke data slices, forcing the GP to create custom reports.
The Solution: Enforce standardized data collection at the portfolio level. Use structured, automated data requests to ensure founders report the exact same KPIs in the exact same format every quarter. For LP requests, adopt industry-standard frameworks (like ILPA) as your baseline to satisfy the vast majority of institutional requirements without needing to build custom spreadsheets.
Modern LP Reporting: Moving Beyond Excel and PDFs
The venture capital industry has historically run on spreadsheets. But as the ecosystem matures and LP expectations increasingly mirror those of public markets, relying on manual file sharing is no longer sufficient. We are witnessing a fundamental category shift in investor relations: moving from delivering static documents to providing an interactive reporting experience.
The most competitive fund managers understand that how you deliver your data is just as important as the data itself.
Static Reports vs Dynamic Dashboards
A static PDF is out of date the moment you hit send. Furthermore, it creates a dead-end for data. If an LP wants to understand the historical progression of your fund's TVPI, or track a specific portfolio company’s valuation over the last three years, a PDF forces their back-office to dig through past emails and manually extract the data.
Dynamic dashboards flip this relationship. Instead of receiving a flat file, LPs access a secure environment where data is visualized interactively. They can view high-level fund performance, drill down into individual asset tearsheets, and seamlessly export the exact data formats they need for their own internal models.
Real-Time Data Access for LPs
Institutional allocators manage complex liquidity schedules across dozens of funds. They cannot always wait for a 45-day post-quarter lag to find their current capital account balance. Modern reporting systems provide LPs with a secure, permissioned portal where their individualized Partner Capital Account Statements (PCAPs), historical capital calls, and unfunded commitments are available on demand. This self-serve architecture drastically reduces the volume of ad-hoc data requests your finance team fields between reporting cycles.
Centralized Investor Communication
When a General Partner relies on standard email to deliver capital calls, distribution notices, tax documents (K-1s), and quarterly updates, critical financial information inevitably gets lost in the LP’s inbox or caught in security filters.
Modern reporting centralizes all investor communication into a single, dedicated hub. This creates a frictionless experience for the Limited Partner, they know exactly where to log in for every fund document, while giving the GP clear, trackable analytics on which investors have actually opened and reviewed their reports.
How Software Improves LP Reporting
Transitioning from fragmented workflows to a dedicated LP reporting platform fundamentally changes how a venture firm operates. It moves investor relations from a reactive, administrative burden to a proactive, strategic advantage.
Here is how adopting a modern software solution upgrades the entire reporting lifecycle:
Automating Data Collection and Reporting
Software eliminates the friction of chasing founders for metrics and manually updating spreadsheets. By setting up automated request workflows, GPs can seamlessly collect standardized KPIs directly from portfolio companies. Once the raw data is submitted, the system automatically calculates core fund-level metrics (like net IRR and TVPI) and populates your reporting templates, saving your finance team hundreds of hours of manual data entry every quarter.
Centralizing Portfolio and Fund Data
Instead of siloing qualitative updates in emails, cap tables in localized spreadsheets, and financials in legacy accounting systems, a dedicated platform acts as your fund’s single source of truth. Software centralizes every data point—from early-stage startup traction to formalized capital account balances. This ensures that the narrative you present to your LPs is always perfectly reconciled and built upon the most accurate, up-to-date information.
Delivering Real-Time Insights to LPs
LPs no longer have to dig through their inboxes to find historical data or wait for a static PDF to understand their current exposure. Software enables GPs to grant limited partners access to secure, permissioned investor portals. LPs can log in on their own schedule to review their individualized capital account statements, download past tax documents, or explore dynamic visualizations of the fund’s aggregate performance.
Improving LP Relationships Through Transparency
Ultimately, the quality of your reporting is a direct proxy for the quality of your fund management. Delivering polished, accurate, and accessible insights signals operational maturity to institutional investors. When you use software to remove the friction of data sharing, you give your LPs exactly what they need to manage their own treasury and liquidity effectively. This frictionless transparency builds deep institutional trust, which is the single most important factor when it comes time to raise your next fund.
When to Upgrade Your LP Reporting Process
For emerging managers deploying their first fund, a well-organized spreadsheet and a clean PDF template are often sufficient. However, as your firm matures, the operational cracks in manual workflows inevitably begin to show.
Knowing when to transition to a dedicated reporting platform is critical for maintaining internal efficiency and protecting your firm's professional reputation. If your team is experiencing any of the following triggers, you have likely outgrown your current setup:
- Your LP Base Is Expanding: Managing 15 Limited Partner relationships via manual email attachments is tedious but manageable. However, as you raise subsequent funds and your LP count grows to 50 or 100+, the manual distribution of individualized PCAPs and K-1s becomes a massive operational liability with a high margin for error.
- Institutional Investors Require Greater Sophistication: As you attract larger family offices, endowments, or fund of funds, their reporting requirements become significantly more rigid. If your LPs are requesting ILPA-compliant data formatting, historical TVPI trend lines, or dynamic access to underlying asset data, simple spreadsheets will no longer pass their operational due diligence.
- Reporting Is Creating an Unacceptable Opportunity Cost: Venture capital is a game of capital deployment and active portfolio support. If your GPs and finance team are spending three to four weeks every quarter chasing founders for data, reconciling Excel tabs, and formatting PDFs, that is time stolen from deal flow and founder assistance.
When the administrative drag of a reporting cycle begins to outweigh the cost of implementing software, it is time to modernize your tech stack.
Frequently Asked Questions
What is LP reporting?
LP reporting is the formal process where General Partners (GPs) share financial performance, portfolio updates, and fund activity with their Limited Partners. It ensures transparency, builds institutional trust, and keeps investors accurately informed about the health and trajectory of their committed capital.
What is an LP report?
An LP report is a structured document or digital dashboard provided by a fund manager to their investors. It details overall fund performance metrics, individual portfolio company updates, recent capital activity, and individualized capital account balances for a specific reporting period.
What are LP reports?
LP reports are periodic updates, typically delivered quarterly and annually, that venture capital and private equity funds send to their Limited Partners. They aggregate financial data, valuation markups, and qualitative GP commentary to provide a comprehensive view of the fund’s current standing.
What should be included in a quarterly report?
A quarterly LP report should include an executive summary from the GP, core fund performance metrics (like IRR, TVPI, and DPI), detailed portfolio company tearsheets, a summary of recent capital calls and distributions, and individualized Partner Capital Account Statements (PCAPs).
What are the 5 steps of financial reporting?
The five steps of financial reporting for venture capital funds are: 1) collecting raw portfolio and financial data, 2) standardizing metrics across all investments, 3) analyzing overall fund and portfolio performance, 4) building the structured LP report, and 5) securely distributing the final report to investors.
What are the three main objectives of financial reporting?
The three main objectives of financial reporting in venture capital are to provide accurate information for LP investment decision-making, demonstrate transparency regarding fund cash flows and capital balances, and ensure strict compliance with fiduciary duties and established industry standards.
How to write an investment portfolio report?
To write an investment portfolio report, start by aggregating standardized metrics from your founders. Calculate fund-level returns, then structure the report logically: lead with a high-level executive summary, follow with core financial metrics, and conclude with individual company updates and individualized LP capital statements.
What is the ILPA template?
The ILPA template is a standardized reporting framework created by the Institutional Limited Partners Association. It provides a uniform format for GPs to report capital calls, distributions, and capital account balances, ensuring LPs receive consistent, transparent, and easily digestible financial data.
What is ILPA reporting in private equity?
ILPA reporting in private equity refers to adopting the Institutional Limited Partners Association's standardized guidelines for fund disclosures. This practice promotes transparency, aligns GP-LP interests, and streamlines the data collection process for institutional investors by using uniform fee reporting and capital call formats.
What is the difference between LP and GP approach?
The main difference is their operational role: General Partners (GPs) actively manage the portfolio, aggregate operational data from founders, and generate performance reports. Limited Partners (LPs) provide the capital, passively monitor their investments, and rely on GP reports to evaluate financial returns and risk.