
Key Takeaways
- Metrics with properties: A Visible portfolio report pairs metric data with company properties like sector, stage and ownership, which turns a list of numbers into cohort analysis in one view.
- Five segmentation criteria: A fund segments a portfolio report by fund, geography, company status, sector and the partner who owns the relationship, then saves the segment for reuse.
- Health as a filter: A fund assigns each company a health or tier status, green, yellow or red, so a report filters to the companies needing attention rather than listing everything.
- Four standard reports: A fund runs a KPI overview, a cash balance and runway report, a revenue performance comparison and an investment overview covering invested capital, fair market value and multiple.
- Scatterplots find outliers: A fund plots revenue growth against runway, or gross margin against net burn, and sizes each bubble by a third variable to surface outliers a table hides.
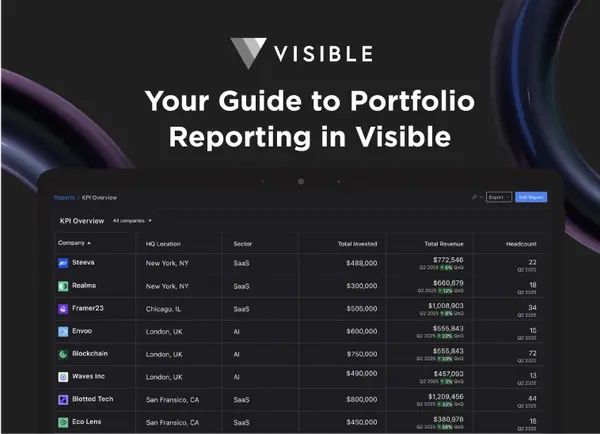
As a venture capital investor, you know that clear, actionable portfolio insights can mean the difference between informed decisions and missed opportunities.
That’s why we created Our Guide to Portfolio Reports in Visible — a comprehensive resource to help you streamline how you visualize, analyze, and communicate insights about your portfolio companies.

In this guide, you’ll discover:
- Common metrics that top VC firms track, such as Revenue, Cash Balance, and Runway.
- Segmentation strategies that enable deeper analysis by Fund, Market, or Partner.
- How to use Visible Portfolio Reports to consolidate portfolio data into one view.
- Examples of portfolio reports showcasing real-world insights from leading firms.
Join 590+ venture capital funds already using Visible to uncover insights, fill reporting gaps, and make data-driven decisions faster.
Are you ready to take your portfolio reporting to the next level? Download the guide below: