

Operating a business across many countries and dealing with multiple currencies presents plenty of unique challenges. Converting and consolidating financial data from QuickBooks, Xero and other sources should not find itself in the “challenges” category; however, it often does.
No reason to fret, the Visible team has you covered with this guide. We’ve helped many customers handle their currency conversion needs with our formula builder and Google Sheets integration but wanted to kick things up a notch with a comprehensive guide.
Transparently, we’d love for you to trial Visible & be a hopefully become a customer, but anyone will be able to find value in our currency and consolidation guide, especially for those of you using QuickBooks, Xero and/or Google Sheets! This guide will be broken down into 3 parts:
- Automatically creating currency exchange rates with our Google Sheet Template
- Combining your QuickBooks or Xero data with our formula builder to consolidate financials to one currency
- Charting & sharing consolidated data using Visible
Currency Exchange Rates with Google Sheets
Our first stop on our journey of currency conversion and consolidation takes us to Google Sheets. Google Sheets is great because their =googlefinance formula is able to grab exchange rates (and historical rates) for any currency.
Rather than make you work for it and end up with something like “=GOOGLEFINANCE(“Currency:”&‘Currency Conversion’!$C$3&‘Currency Conversion’!$C$4,“price”,‘Currency Conversion’!F1,‘Currency Conversion’!Q1,“Daily”)” we decided to play nice and do the work for you.
In the Google Sheet you’ll find 3 tabs. For you #lazyweb people, you can skip to the next section. For those who want to learn about the 3 tabs, keep reading. You can download the Google Sheet Template and follow along using the form below:
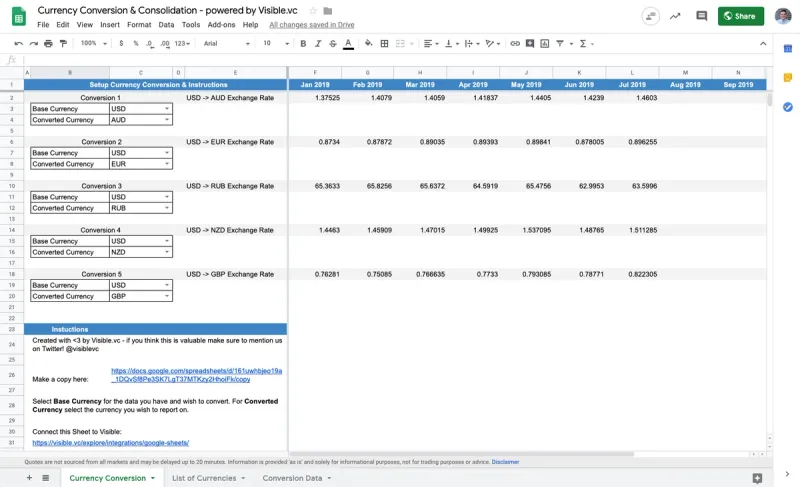
The first tab lets you make your selections of base currencies & the converted currencies. We’ve set it up to automate up to 5 different conversions. This is the tab you’ll be able to connect to Visible as well.
The second tab is just a simple list of countries, their currency, currency code & number. Thanks to IBAN for providing this list to us. This is the list that powers the dropdown in Column C on the first tab.
The final tab is the actual Conversion Data. This is where Google Sheets and the =googlefiance formula does its magic. This tab references your inputs from the first tab and will spit out all of the daily exchange rates for the given currencies year-to-date.
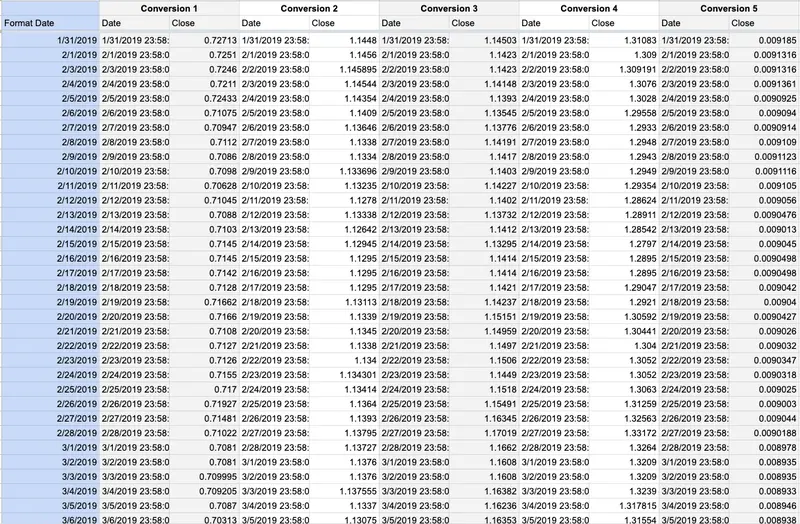
Funnily enough, Google sends us a date/timestamp that does not play nice with the =vlookup we need on the first tab, so we added a Format Date column. This Sheet will update each day with the latest rates.
Note: For the purpose of this project, we are taking the exchange rate on the final day of the month and assigning that as the exchange rate for the month. You are welcome to change the formula to be an average or a rate that you personally observed with your own bank.
p.s. if you don’t want to use Google Sheets, you can always enter in your own exchange rate data using our User Provided Metrics.
Consolidating with QuickBooks, Xero & the formula builder
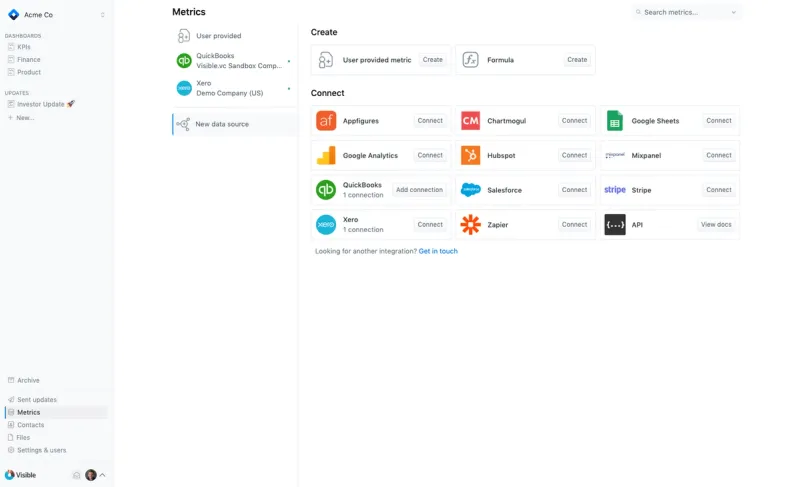
The first thing we will want to do is get your financial data into Visible from QuickBooks and/or Xero. You can also upload data through Google Sheets or Excel (User Provided Data).
Head over to our knowledge base if you need any help integrating with QuickBooks or Xero. If you need any additional help you are always welcome to contact support as well.
The next thing we will want to do is get automated exchange rates from the Google Sheet we setup.
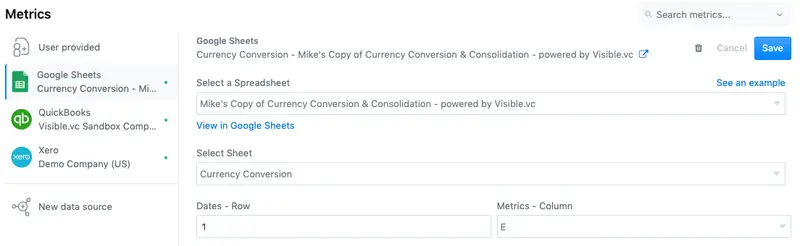
Assuming the template was not changed, the dates will be in row 1 and metrics in column E. If you made your own changes, then enter the respective column/row here.
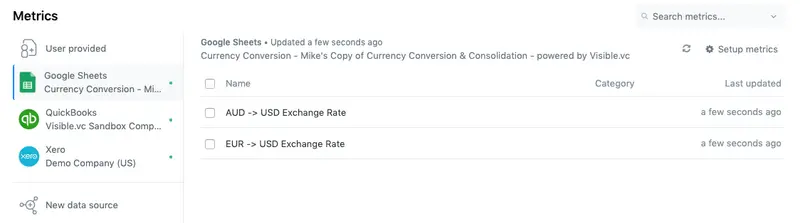
In my example, I am going to Consolidate Revenue to USD from QuickBooks (AUD), Xero (EUR) and User Provided Data (USD). This means I’ll have 2 exchange rates created for me looking like this:
Now it is formula time. Head over to “New data source” and create formula. Your formula will look something like:
Consolidate Value = Metric (in base currency) + (Metric 2 & Exchange Rate) + (Metric 3 * Exchange Rate) etc etc. For my example it looks like this:
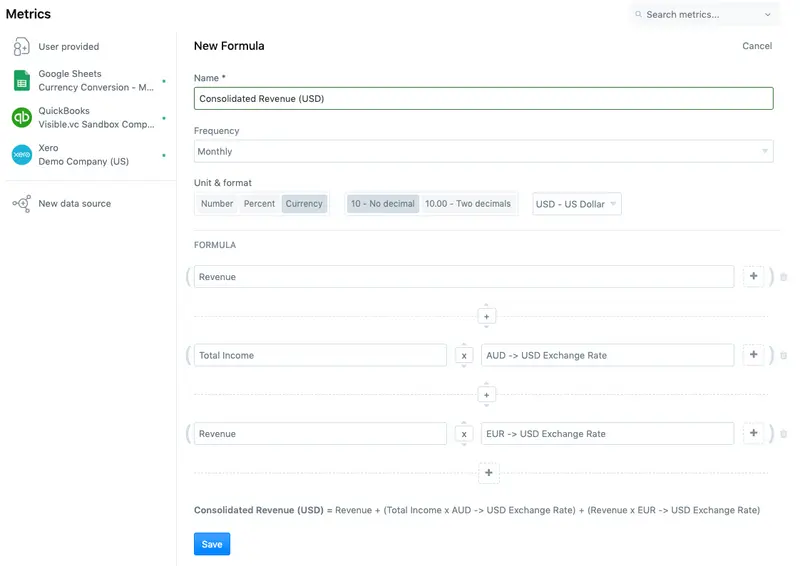
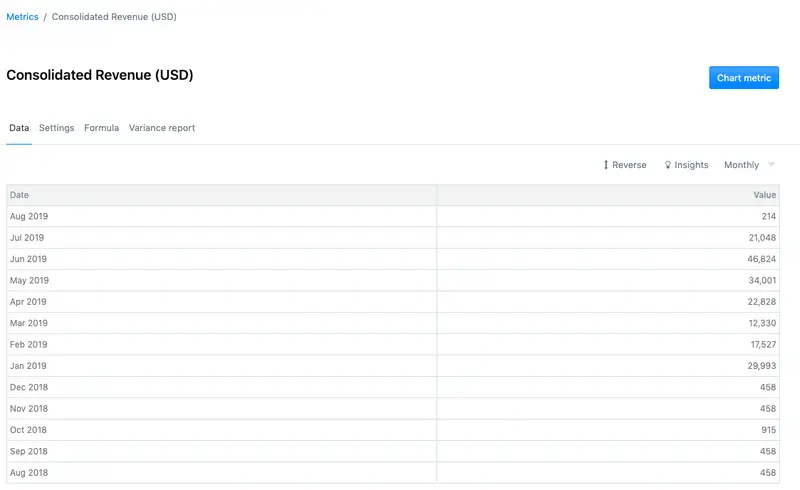
Hit “Save” and now we have our consolidated metric!
Charting Consolidated Financial Data with Visible
This part is the easiest and happens to be the most fun. Once you have your consolidated metrics created, you can use them in charts, tables and Updates.
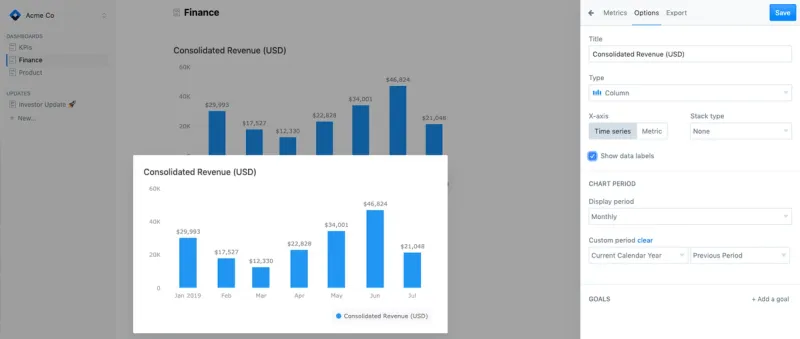
These charts will always be up to date with your data syncing from Sheets, QuickBooks and Xero every night. If you want to level up your Consolidation Reports, check out our Variance Reporting module to generate your Month-to-Date and Year-to-Date variance reports.
We hope you found some value with this guide and our Google Sheet template. If you need any additional Visible help or have any questions, you can contact us here.
Up & to the right,
-Mike & The Visible Team


