When 11 Tribes Ventures took the stage at its 2026 annual meeting, many of the charts came straight from Visible. Here is how VP Isaac Arnold collects, verifies, and reports the data that earned the firm new credibility with its LPs, in roughly 10% of the time it used to take.
The Challenge: A Growing Portfolio Outgrew the Spreadsheet
Isaac Arnold is Vice President at 11 Tribes Ventures. He leads diligence and research, sources new deals, and supports portfolio companies. He also owns all of the firm's performance data, at the fund level and for every company.
For years, that data lived in spreadsheets. As the portfolio grew past 50 companies across two funds, keeping company metrics and investment data in sync became the hard part.
"As our portfolio continued to grow, it became increasingly difficult to manage individual company metrics, investment reporting data, and how those two should inform each other."
That data serves three audiences. The internal team uses it to know where founders need support. LPs get more granular, accurate reporting. And founders increasingly use Visible themselves as a source of truth for their own investor updates and board meetings.
11 Tribes tried to build a solution in-house. When that wasn't living up to the standards they expected, the team evaluated several tools and chose Visible as the best option in the market.
The Annual Meeting: Clean Data on Center Stage
11 Tribes gathered fund investors, plus prospective LPs, in Chicago's West Loop. The agenda showcased every side of the firm: a leadership session, a Culture Index presentation on founder profiling, founder panels, and portfolio presentations from select companies.
The day closed with Isaac and Mark Phillips walking through investment performance for both funds and the firm's view on AI. That section ran on Visible.
"The annual meeting went very well and Visible was certainly at the forefront. Many of the slides and graphs I shared with our investors from the stage were directly built in Visible."
Using Visible, Isaac built a slide for the most important key performance metrics:
- Gross MOIC and gross IRR by quarter since each fund's inception
- Net MOIC and net IRR on the same view
- Number of investments over time
- Percentage of each fund deployed
- Split between initial and follow-on investments
- Distribution of returns across the portfolio, shown in histograms and pie charts
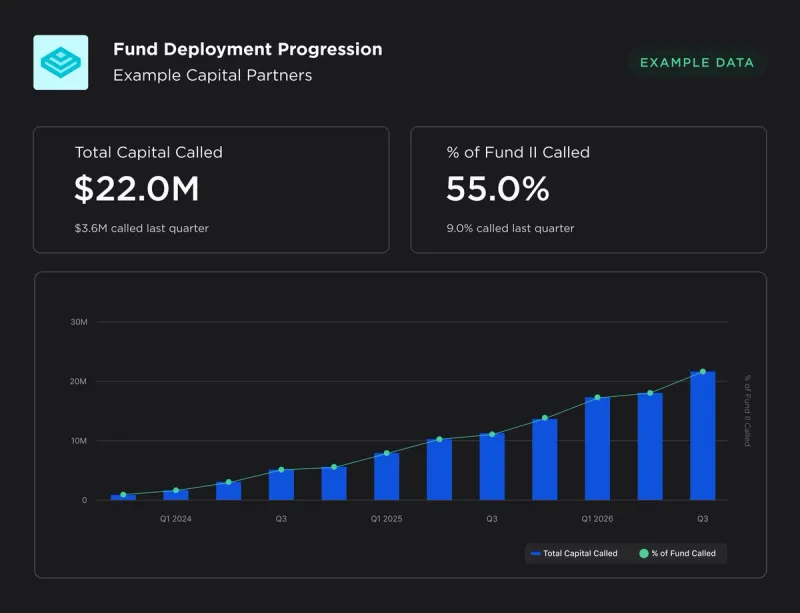
Return-distribution views let LPs see at a glance how broadly value is spread across each fund's portfolio.
The goal was bigger than any single chart. 11 Tribes wanted LPs to see how much data the firm collects and how rigorously it tracks every company and fund.
"Visible's tools, especially its graphical displays, were incredibly valuable in helping our team communicate how our funds and individual companies are performing, in a way that shows the rigor we bring to the table and how accurate our reporting has become."
Collecting the Data: An AI Agent That Feeds Visible
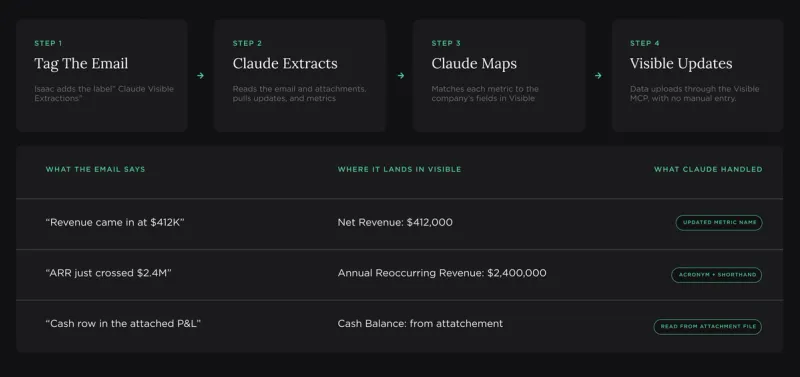
Isaac uses every intake path Visible offers, including Requests and the AI Inbox. But about 90% of 11 Tribes' data now flows in through Visible's MCP server, powered by an agent he built in Claude Cowork.
Here is how it works:
- Isaac tags any incoming email or file with a "Claude Visible Extraction" label.
- Claude reads the email, pulls the attachments, and extracts every qualitative update and quantitative metric.
- Claude pulls the data fields Isaac has set up in Visible for that company and maps each metric to the right one. If a founder writes "revenue" but Visible tracks "Net Revenue," Claude handles the match.
- The data uploads into Visible through the MCP.
New companies go through the same pipe. Isaac hands Claude everything the firm already has, and Claude builds out the full metric set and uploads it.
"It has completely changed how much manual entry we do. I do virtually none anymore. Almost nothing I put into Visible is typed by hand."
The effect reaches founders too. Because so much data arrives automatically, a founder who opens a Visible Request often finds it already half filled out, which makes them far more likely to finish it.
And the MCP is not just Isaac's tool. Everyone on the 11 Tribes team has a Visible connection in Claude, so instead of logging in to look something up, they simply ask their questions in the same chat experience they’re already working in for other contexts.
Verifying the Data: Confidence Before It Goes on Stage
Numbers shown to LPs from a stage have to be right. For Isaac, the confidence comes from traceability.
"When you try to manage portfolio company and fund metrics in Excel, things get blurry, and it's hard to understand why you did what you did."
In Visible, every mark has a paper trail. If 11 Tribes marks up a company on strong revenue growth, Isaac attaches the supporting documents to that specific transaction, within that company, within that fund. Months later, anyone can see why a number is what it is.
Three checks keep errors from slipping through:
- Period-over-period comparisons. Every metric Isaac reports shows its quarter-over-quarter change, front and center in his Visible dashboards.
- Visual outlier detection. With charts for every company and fund, Isaac can easily spot an extreme drop or unusual spike.
- AI flags on intake. When Claude extracts new metrics through the MCP, it compares them against historicals and flags dramatic changes for Isaac to investigate.
Underneath it all is one system for funds, investments, and company metrics. Isaac sees that as the foundation of credible fund reporting.
"The only way to have strong fund reporting is to have strong reporting on company fundamentals. Doing fund reporting removed from the intrinsic growth of those companies is a fool's errand."
Reporting the Data: From Dashboard to Slide in One Click
The annual meeting was not a one-off. Many of the charts LPs saw on stage are the same ones they receive every quarter.
That consistency has paid off. Isaac says the quarterly cadence of clear, visual reporting has built real credibility for 11 Tribes with its investors and the broader market.
The prep work itself has shrunk dramatically. Quarterly company and fund reports now take Isaac about 10% of the time they used to, and he reports more than ever.
"Before Visible, some things were simply too difficult to collect and communicate, so I didn't report them; now I do."
The Results
Visible has changed how 11 Tribes reports to LPs and how the team runs the portfolio day to day.
- 90% less prep time. Isaac estimates that's how much time he has saved preparing presentations and quarterly reports, with significantly better data quality.
- More to show. About 90% of what 11 Tribes presented at this year's annual meeting would not have been possible before Visible.
- LP credibility. Clear, consistent visuals every quarter have strengthened trust with investors and the market.
Asked how he would describe Visible to a peer at another firm, Isaac didn't hesitate:
"Visible is the best platform to gather, understand, and communicate the progress, performance, and impact of every company and fund."
Learn more about how you can put Visible to work for your fund below: