What is Total Addressable Market (TAM)?
According to the Corporate Finance Institute, “The Total Addressable Market (TAM), also referred to as total available market, is the overall revenue opportunity that is available to a product or service if 100% market share was achieved. It helps determine the level of effort and funding that a person or company should put into a new business line.”

Related resource: What Is TAM and How Can You Expand It To Grow Your Business?

“TAM” is one of those buzzy acronyms that VCs love to throw around. For those following along at home, TAM = Total Addressable Market. It helps paint the picture of how big the opportunity is and if the business deserves to be venture-backed.
TAM is a funny thing. Early on, many investors passed on Uber, wrongly seeing it as little more than a black car service for affluent San Franciscans.
The type of analysis that led many to overlook Uber (when it was still called UberCab) mirrors the approach that Benchmark’s Bill Gurley criticized NYU professor Aswath Damodaran for a couple of years later in a piece called “How to Miss By A Mile: An Alternative Look at Uber’s Potential Market Size”
“Let’s first dive into the TAM assumption. In choosing to use the historical size of the taxi and limousine market, Damodaran is making an implicit assumption that the future will look quite like the past.” – Bill Gurley
The most forward-thinking investors were able to see past the limited size of the initial niche targeted by the company and see something closer to what the company has become — a $50 Billion valuation with operations in 67 countries and offerings ranging from food delivery to carpooling.
TAM vs. SAM vs. SOM: What’s the Difference?
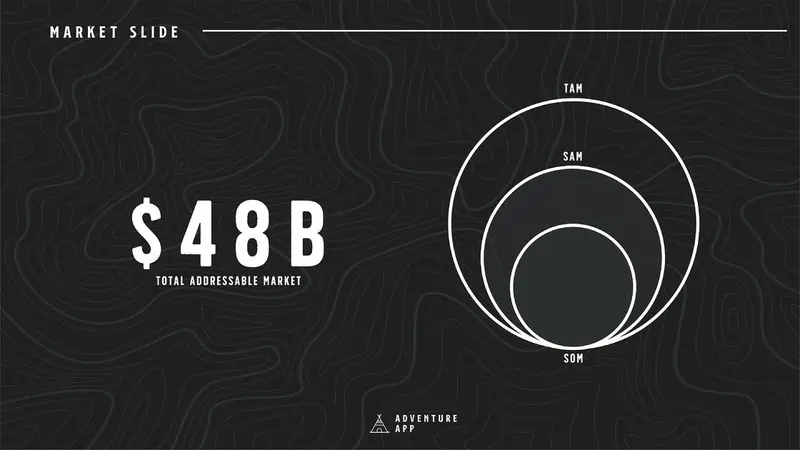
Total addressable market (TAM) is often associated with SAM and SOM. First, let’s understand SAM and SOM:
- TAM: Total Addressable Market
- SAM: Serviceable Available Market
- SOM: Serviceable Obtainable Market
TAM looks at the overall market but you can dial this number in with a more realistic approaching using both SAM and SOM.
SAM (Serviceable Available Market)
As defined by Steve Blank, “The serviceable available market or served addressable market is more clearly defined as that market opportunity that exists within a firm’s existing core competencies and/or past performance. The biggest consideration when calculating SAM is that a firm most likely can only service markets that are core or directly adjacent to its current customer base.” This means that SAM is how many customers (in revenue) actually fits your company and product line your are building. This differs from TAM as your TAM is a look at your entire market, not factoring in what percentage is actually achievable to close.
Related Resource: Total Addressable Market vs Serviceable Addressable Market
SOM (Serviceable Obtainable Market)
SOM or serviceable obtainable market dials in your target market one step further. SOM is the percentage of the market that you can actually reach with your product, sales, and marketing channels. This should be a realistic view at the customer base your company can pursue.
Related resource: Service Obtainable Market: What It Is and Why It Matters for Your Startup
How to Calculate TAM
When it comes to financial modeling and building a TAM for your business, there are a few different approaches. The most common being top-down and bottom-up approaches.
Top-Down
While a top-down approach to modeling is oftentimes the easiest, it is generally less accurate than a bottom-up approach (more on this below). According to inc.com, “A top-down analysis is calculated by determining the total market, then estimating your share of that market. A typical top-down analysis might go something like this: ‘Hmm… I will sell a widget everyone can use, and since there are 300,000 people in my area, even if I only manage to land 5 percent of that market I’ll make 15,000 sales.’”
For example, if you were to find a market to be $10 billion and you believe that you can capture 1% of the market that is $100 million in revenue. This number might get circulated when fundraising, only to find out that there are many more factors that go into penetrating a new market.
Bottom-up
On the flip side is a bottom-up approach. Oftentimes more accurate but also requires more work and more data. As the team at inc.com describes a bottom-up approach, “A bottom-up analysis is calculated by estimating potential sales in order to determine a total sales figure. A bottom-up analysis evaluates where products can be sold, the sales of comparable products, and the slice of current sales you can carve out. While it takes a lot more effort, the result is usually much more accurate.”
For example, let’s say we have software that sells for $10/mo. This means that the average consumer would spend $120/year. From here, we need to figure out how many consumers or customers we could add. Using past marketing website data, we believe that we can add 100 customers a month or $12,000 in recurring revenue (learn more about metrics here). Next, we can begin to model the growth of marketing site users and conversions to forecast what revenue might look like in 12 months.
Related resource: Bottom-Up Market Sizing: What It Is and How to Do It
Value Theory Approach
As put by the team at HubSpot, “The value-theory approach is based on how much value consumers receive from your product/service and how much they’re willing to pay in the future for that product/service.” This requires certain data and assumptions that might take some added research.
For example, let’s say that we sell snowboards and the ones we are creating are lighter, faster, and better for the environment than the normal snowboard. We could calculate our value theory by taking the price shops are selling a traditional board for, let’s say $300, and figure out how much more they’d be willing to sell your state-of-the-art product for — maybe $350 or $400.
External Research
One of the quickest ways to calculate your total addressable market is by using professional data from outside sources. There are countless companies (like Gartner and Forrester) that produce rich data reports on specific markets and verticals that can be a great launching point. Note: these often come at a hefty price. This is generally not the best approach as it is difficult to understand where the data came from and how it is being calculated.
Questions to Ask Before You Calculate TAM
There are many different approaches when it comes to calculating your TAM. At the end of the day, you’ll want to make sure you are setting realistic expectations and are painting a picture of reality. A couple of questions to consider asking before calculating your TAM:
- What are the characteristics of our current and potential customer profiles?
- What industries should we target to maximize sales?
- Where are the companies in those industries located?
- Who buys our solutions? How big are these companies?
- What are the market conditions like? Is the market growing? Are there new entrants?
- How does our budget compare to our competitors’ budgets?
- Where is growth expected?
The Free Visible Total Addressable Market Template and Evaluation Model
In order to help founders model their TAM and sensitivity analysis, we created a free Google Sheet template.
You can find the Google Doc here: Visible.vc – Market Sizing, TAM & Sensitivity Analysis. Simply open it up and click the arrow on the bottom left sheet and copy it to your own Google Sheet workbook. Below, I’ll explain the process and instructions.
You’ll see step-by-step directions for using the template below.
Where Does Your Total Addressable Market Start (and End)?
Before calculating the actual size of the market you are looking to capture, you first need to try to build an understanding of where that market begins and ends.
Many companies, like Uber, start out in a specific niche with plans to scale into adjacent markets that allow them to apply their product and operational expertise to a different set of customers or a different geographic location. However, taking a company that is excelling in one niche and extrapolating their growth across multiple markets is a difficult task for both companies and the investors evaluating them.
“Sequencing markets correctly is underrated, and it takes discipline to expand gradually. The most successful companies make the core progression—to first dominate a specific niche and then scale to adjacent markets—a part of their founding narrative.” – Peter Thiel, Zero to One
One year ago, Uber’s Gross Revenue in San Francisco was $500 Million. Assuming a 20% cut, we get to just $100 Million a year. 5 years ago, connecting the dots forward to see how they could move from that to what they have since become took a combination of masterful storytelling from Travis Kalanick and his team as well as a large leap of faith by the investors evaluating them. This is a potential pitfall of using a TAM based on historical market sizes for truly game-changing businesses (as Gurley’s quote from above illustrates).
Another oft-committed mistake surfaces with many Ecommerce companies, who claim to be chasing the $1.6 Trillion Global Ecommerce Market. Sure, it is a huge number. But it is one that investors will see right through, much like highly inflated financial projections or overly ambitious product roadmaps. In reality, most ecommerce businesses are addressing the X $ spent each year on Y problem(s).
Why Should Startups and Growing Companies FOcus on TAM?
How many customers are there in our market? What is their propensity to pay? How many customers can we realistically support? What % of the market can we get in 10 years? Can we be the market leader?
Forecasts
Using TAM is a good base for creating future forecasts and projections. Using a bottom-up approach is a great way to help forecast where you believe your business can be in the future. This is particularly important when thinking about fundraising, hiring, and budgeting for the next X months.
Related Reading: Building A Startup Financial Model That Works
Fundraising
Different investors might have different preferences when it comes to presenting TAM during a pitch. If an investor does want to see your TAM estimates, it is generally suggested to use a bottom-up approach.
As the team at DreamIt Ventures puts it, “The biggest mistake we see with regard to TAM is when founders present a “top-down” estimate of market size. A top-down estimate is when a founder uses outside data to find the market size and then, usually somewhat arbitrarily, predicts that the startup will achieve a piece of that invariably massive pie.”
Related Reading: How to Write a Problem Statement [Startup Edition]
Related Reading: 6 Types of Investors Startup Founders Need to Know About
Building Your Total Addressable Market Model
You can find the Google Doc here: Visible.vc – Market Sizing, TAM & Sensitivity Analysis. Simply open it up and click the arrow on the bottom left sheet and copy it to your own Google Sheet workbook. Below, I’ll explain the process and instructions.
First, you’ll want to start either with a top-down or bottom-up approach (more on the differences here). For this model and exercise, we recommend bottom-up.
If you are a SaaS company you may want to break down between SMB, Middle Market, and Enterprise and the yearly contract sizes for each type. Ecommerce companies may want to break down by yearly revenue per customer type. The model should work for any type of business. For marketplaces, we would recommend your transaction cut and not “Gross Merchandise Value.”

Feel free to replace the “Customer Type” headers with your own descriptions. The green cells are the inputs for a number of customers and pricing for each respective type. The 100% market penetration is a quick gut check to say “If we captured 100% of the stated market how big would our business be?”
After the inputs have been entered you’ll see a Sensitivity Analysis that provides Yearly Revenue based on your % of Market Penetration and Pricing. We use the Total Number of Customers from your inputs and various Yearly Revenue numbers to provide the results.
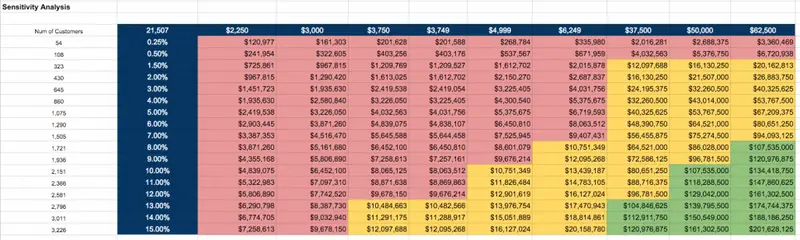
In the first column, I just added a simple calculation for the Number of Customers. This simply takes % of Market & Total Customers. It also provides a quick gut check…e.g. “Is it reasonable to acquire and service X customers?”.
The analysis is color-coordinated. Red means your business is below $10 Million a year, yellow is $10 Million to $100 Million and green is >$100 Million a year in revenue. Most investors will want to see a clear path to $10 Million per year and the vision to get you to $100M. Anything short and they will likely tell you that “your business is not venture backable and you won’t be able to return our fund.”
We hope you enjoy this template. If you have any feedback, suggestions, or questions send them our way! If you found this to be valuable we’d love for you to share it. Just click this link and it will craft a pre-populated Tweet (that you are welcome to edit).
Streamline and Deliver Investor Updates with Visible
Raise capital, update investors and engage your team from a single platform. Try Visible free for 14 days.