
Tear sheets are an important component of the venture capital industry. If you’re new to VC, it's crucial to understand what a tear sheet is and how to create a valuable and effective one for your fund.
What is a Tear Sheet?
A tear sheet is a single-page summary of an individual company. A tear sheet is a critical term to understand in the venture capital world. Beyond a simple understanding of what a tear sheet is, it’s important to learn how a tear sheet is best used and how to create one. The term “tear sheet” originated from pre-internet business when S&P would produce summary sheets for public companies on one page. All of these single-page summaries could be torn out of a larger book containing all of the summary sheets. This act of tearing out the relevant page stuck around. Even though the physical act of tearing a sheet is gone, the single-page summary, the tear sheet, has withstood the test of time and is an extremely important piece of collateral for anyone working in VC to understand.
A tear sheet should contain overview information about a company. This should include the total investment amount, gains/losses, sector, and a summary of company performance. Essentially, anything that will allow the reader to get a quick snapshot of the business and give them an understanding of earning potential that is possible should be included on the tear sheet.
The LPs (limited partners) or investors at a VC firm are a key audience that will be viewing the tear sheet. You want to make a good impression when presenting information to LPs. Therefore, when thinking about putting together tear sheets for your portfolio companies, it’s important to make them look professional and use them to effectively communicate concise updates about your companies. Well-put-together tear sheets can go a long way in impressing LPs.
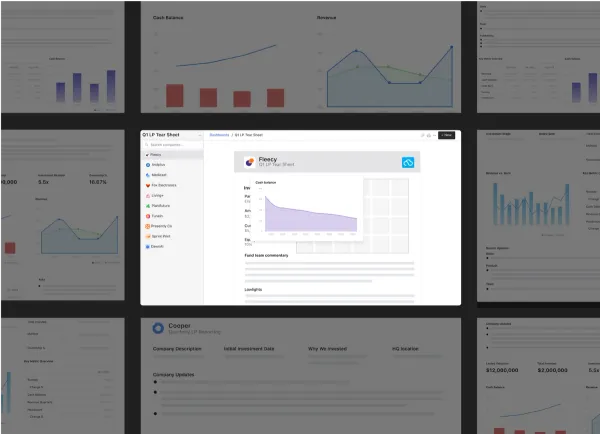
View Tear Sheet examples from Visible.
Tear Sheet Templates
When building out tear sheets for your portfolio companies, make sure to include both metrics and qualitative data about your companies. If you’re looking for a tear sheet template (read on to learn more about tear sheet templates in Visible!) make sure to find a template that includes both of these categories.
Start with metrics, or quantitative data about the company. A few metrics to consider including*:
- Revenue – Revenue and revenue growth over time is an easy way to understand the health status of a company. While not an accurate portrayal of the company as a whole, it gives LPs a sense of the stage of the company.
- FTE Headcount & New Hires – This is typically considered non-sensitive data from portfolio companies but again gives LPs an idea of the stage of the company and how they’re growing over time. It also is an indicator of how a company is using their cash.
- True North KPIs – Depending on the type of company, this might differ. The true north KPIs in a tear sheet template should be the key performance indicators that are guiding the business every single day. Beyond revenue goals, examples of other KPIs could be active users, a customer net promoter score, active customers, or average contract value.
*Note: It’s important to maintain privacy for portfolio companies and receive permission to share information with LPs. It’s also a best practice to share the same level of detail across all companies.
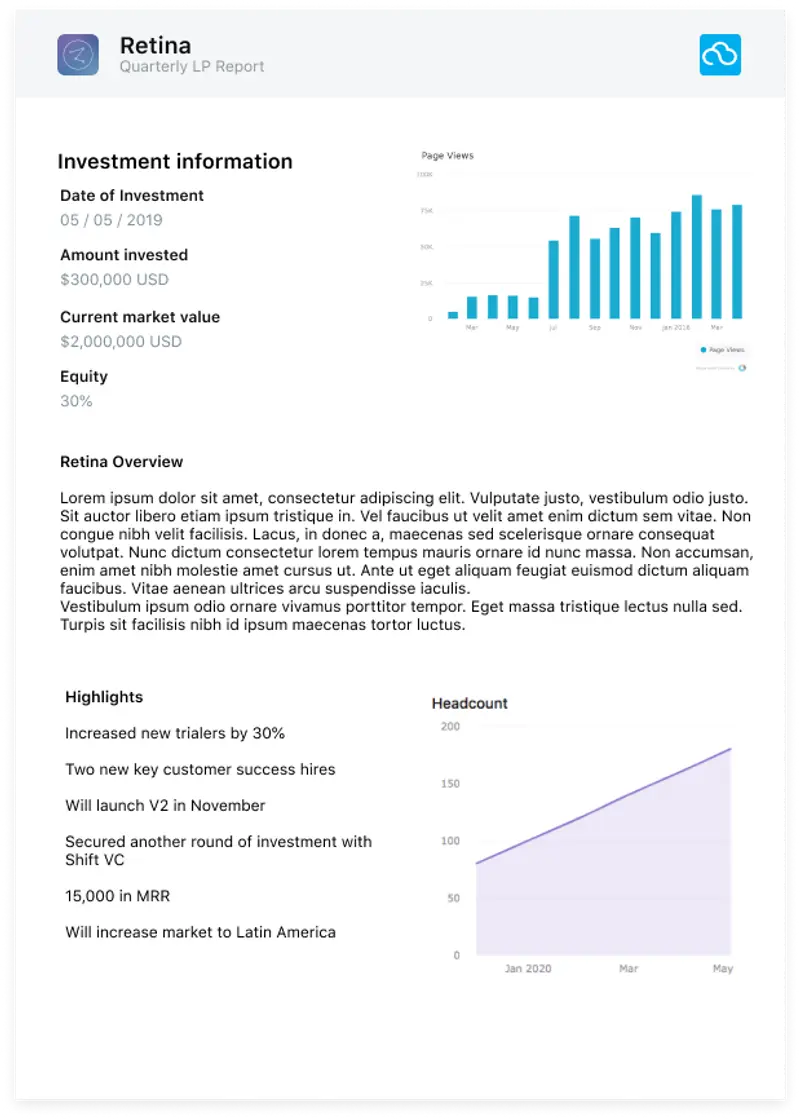
Another important section to include on a tear sheet is an investment overview. Some items to include are:
- Total Invested – It’s helpful to remind LPs about the total invested in a company and how it compares to others in the portfolio.
- Date of Initial Investment – This gives a sense of how long it has been since the initial investment and gives context on when to expect a return.
- Investment Multiple – This provides LPs with an idea of the expected return in the future.
Shifting from the metrics on your tear sheet template, consider the following qualitative points to include in your tear sheet:
- Company Tagline – This is an easy and concise way to orient or remind an LP about what the company does.
- Sector – This simple static property again helps provide context to LP’s who have invested in several funds.
- HQ Location – Helps everyone stay on top of where the portfolio is located.
- Narrative Update – This section is a commentary on recent highlights from the portfolio company. As always, it’s important not to disclose sensitive information about a portfolio company.
- Asks – Depending on your relationship with your companies and LPs, it may be appropriate to share ‘Asks’ from portfolio companies with LPs. For example: Company A is looking to hire a Head of Engineering based in Berlin and is seeking candidate referrals.
Tear Sheet Examples
A great place to start when creating your portfolio tear sheets and looking for tear sheet examples is to ask your network. Talk to experienced funds in your network. If they’ve raised several funds and have close relationships with their LPs, they probably have a great idea of what LPs like to see when receiving updates about portfolio companies.
You can also check out Visible’s Tear Sheet Examples here.
Using Visible for Portfolio Tear Sheets
Visible is an incredibly useful tool for funds to report to the LPs on a consistent basis. You can take the quantitative data and qualitative information suggested above and turn it into a template right in Visible. Check out a tear sheet example in Visible below.
How Visible Automatically Builds Tear Sheets
Visible is the perfect tool to build tear sheets for all your companies in just a few clicks.
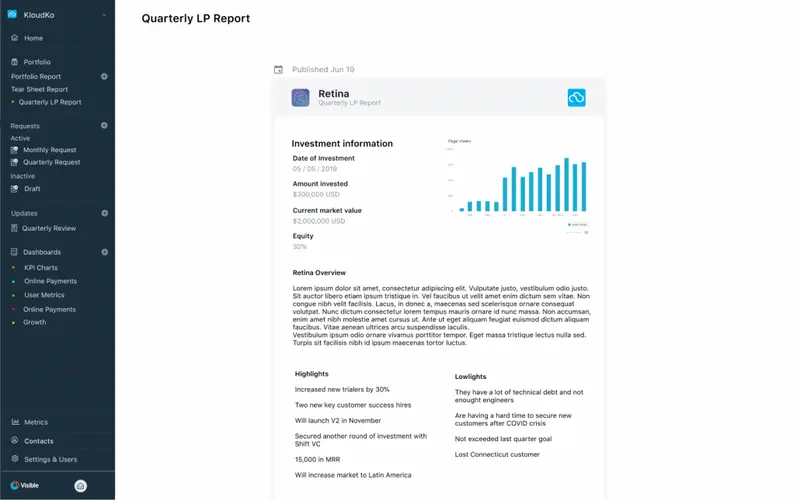
Visible automatically builds tear sheets by:
- Equipping investors to automatically collect structured data from portfolio companies on a regular basis. As an investor, you can decide what data is most relevant to request from each company.
- Creating tear sheet templates that automatically pull in metric data, investment data, and qualitative properties that already exist within Visible.
Interested in exploring how to build Tear Sheets in Visible?
Tear Sheet Basics
If you're searching for the best company tear sheet template, you're not alone. Tear sheets have become a go-to resource for venture capital (VC) firms and investors who want to deliver quick, effective updates to limited partners (LPs). Whether you're looking for a free tear sheet template, trying to understand what a tear sheet is in business, or need a tear sheet example to model your own, knowing how to structure and present this information is crucial.
A tear sheet (sometimes called a one-pager) is a concise summary of a portfolio company. It typically includes key metrics, investment details, and recent updates. For VCs, it's a powerful way to maintain transparency and professionalism with LPs. If you're new to this, a VC tear sheet example can offer a strong visual starting point. Platforms like Visible allow you to skip this step by making it easier than ever to pull live data from your existing dashboard to generate a polished tear sheet template in seconds.
For those managing this process manually, there are several formats to explore: a tear sheet template Word, tear sheet template PowerPoint, or even a tear sheet Excel template, many of which are available as free tear sheet template downloads. A free VC tear sheet example can show you how to create a tear sheet that balances both quantitative metrics and qualitative context. This is especially helpful for those asking, “What is a tear sheet in business strategy?” or looking for the best LP tear sheet example PDF to elevate their investor communications.
Whether you're refining your own internal workflow or just getting started, Visible’s platform offers tear sheet generation to streamline the process. You’ll save time, improve consistency across your portfolio, and present the kind of clear, confident communication that LPs expect.


