Blog
Metrics and data
Resources related to metrics and KPI's for startups and VC's.
All
Fundraising Metrics and data Product Updates Operations Hiring & Talent Reporting Customer Stories

founders
Metrics and data
Current Ratio and Liquidity Ratio
As we’ve discussed before calculating your quick ratio is an easy formula to understand how efficiently your company can grow. The higher the quick ratio the more efficient a company can grow. An example quick ratio formula can be found below:
Quick Ratio Formula = (New MRR + Expansion MRR) / (Contraction MRR + Churned MRR)
In addition to the quick formula, we see many startups track two other financial ratios: current ratio and liquidity ratio. Tracking different financial ratios can be an integral part of a companies’ success as they offer a quick and easily digestible way to understand where your company stands. Where a quick ratio observes your short term financials, the current ratio and liquidity ratio observe all of your assets and long term obligations.
Liquidity Ratio
Liquidity ratio or liquidity ratios are often seen in a similar sense as a quick ratio and can be used as an umbrella term. Both quick ratios and current ratios are a different form of liquidity ratios. According to Investopedia, “Liquidity ratios are an important class of financial metrics used to determine a debtor’s ability to pay off current debt obligations without raising external capital. Liquidity ratios measure a company’s ability to pay debt obligations and its margin of safety through the calculation of metrics including the current ratio, quick ratio, and operating cash flow ratio.”
Related Resource: From IPOs to M&A: Navigating the Different Types of Liquidity Events
Liquidity ratios are important to startups and their investors because it helps determine if a startup can meet their current debt obligations.
Current Ratio
As mentioned above, a current ratio is a form of a liquidity ratio. A current ratio is a longer term look at a companies’ debts and assets. The current ratio formula is very simple and can be found below:
Current Ratio Formula = Current Assets / Current Liabilities
While different companies may interpret what counts as an asset differently, a current ratio of 1 is generally accepted as a good current ratio value. Whereas a quick ratio often observes just your recent revenue, a current ratio takes a holistic view at all of your assets and liabilities which causes a bit more variance from company to company.
All in all, tracking your liquidity ratios (current ratio and quick ratio) can offer both startup leaders and investors a high level view of the companies ability to grow and cover their debt obligations.

founders
Metrics and data
Quick Ratio Formula
The SaaS Quick Ratio is a simple formula used to measure the efficiency of your SaaS company’s growth. A quick ratio gives a company a reliable source to predict how they can grow revenue with churn in mind. In short, the quick ratio formula is new MRR by lost MRR over a period of time. The higher your quick ratio the stronger the growth. The quick ratio formula can be found below:
Quick Ratio Formula = (New MRR + Expansion MRR) / (Contraction MRR + Churned MRR)
A low churn rate is often the most efficient way to grow your SaaS business. While new MRR is vital to a company’s success as well, a high churn rate will make it virtually impossible to have a sustainable growth rate. As Tomasz Tunguz puts it, “If the churn number is unsustainably high, we know from previous churn analyses that high churn implies lower growth rates and dramatically less efficient growth.”
While a high MRR growth rate can mask a high churn rate, the best-in-class companies always have a low growth rate, creating a much higher quick ratio.
Quick Ratio Formula in Visible
Creating a quick ratio formula in Visible is incredibly easy with our formula builder. First, you’ll want to make sure you have your recurring revenue metrics in Visible. We would suggest using user provided metrics or using Google Sheets, Salesforce, HubSpot or ChartMogul to automatically get your recurring revenue metrics in Visible.
Once your metrics are in Visible, you’ll want to start building your quick ratio formula. To start, add any new and expansion MRR metrics in the top line. For our quick ratio formula we only mention MRR and Expansion MRR but this could include reactivated, multiple product, etc. On the bottom row, you’ll want to add any “loss” MRR metrics, like contraction and churned MRR.
After the quick ratio formula is setup, it will automatically be calculated as any new data comes in from your integrations. Next, you’ll want to visualize, distribute, and act on your quick ratio. We suggest sharing your quick ratio with managers and executives on your team so everyone has an easy way to understand the growth of your company at a quick glance. Generally, we do not see companies share their quick ratio with their investors as if you have a down month or period it may display poorly and generate unnecessary concerns.
Tracking your quick ratio is a great way for SaaS companies to get a quick idea of how efficiently they are growing. The easiest way to strengthen your SaaS quick ratio is by shrinking your monthly churn rate. Learn more about your quick ratio here.

founders
Hiring & Talent
Metrics and data
An Update Template for Sharing Your HubSpot Funnel Metrics
What campaigns are working? What content is performing best? Where can we improve inefficiencies? Where should we double down? Continuing to review, analyze, and “duct-tape” your funnel is key to executing an agile marketing playbook.
“Data doesn’t do you any good unless you act on it. Each of these metrics clearly tells you how you’re doing. Right away, you’ll know where you need to spend your time.” – Andrew Chen, a16z
General Funnel Metrics
Automatically bring in general funnel metrics using our HubSpot integration. Bring in basic lead counts or use filters to bring in granular funnel metrics to dig into where you can improve the most. You can check out examples for bringing in different pipeline stages below:
Different Lead Stages; subscribers, MQLs, SQLs, PQLs, etc. – Start with “Contacts” as your HubSpot Object. Anchor the date to any field you or HubSpot are automatically tracking; create date, became an XYZ date, etc. From here, you can filter your different contacts however you’d like. For this example, we our simply using our “Lifecycle Stage” but can easily break that down by different sources, personas, sales reps, etc.
Note: Use the value field to tie a monetary value to your metrics. For example, using “Deal Amount” to bring in the value of all of the contacts in a certain stage. From here, you can use formulas to calculate the weighted value of different pipeline stages.
New Customers – Start by connecting the object where you are tracking new customers and their value; likely companies or deals. Just as you would for lead stages, you’ll want to anchor the object to the field that denotes a new customer; lifecycle stage, etc. Use the value field to bring in a simple count or the total dollar amount for won deals. Easily take a look at the row level data to see where customers are coming from, renewal dates, and more.
Top of Funnel: Lead Source Breakdown
Marketing attribution is tough. Staying on top of your lead sources and continuing to tweak and improve inefficiencies is a quick way to keep your growth metrics moving in the right direction. Keep tabs on where your leads are coming from by filtering different leads by their lead source.Use “Filters” when connecting HubSpot to Visible to break down new leads by different sources, campaigns, and events. Drill down using row level data to see what specific leads are coming from what sources.
You can check out an Update example for sharing your funnel metrics and lead sources here.

founders
Metrics and data
Use Sheetgo To Consolidate Your Google Sheets Reporting
Hate them or love them, spreadsheets are here to stay. Everyone has been a part of the confusion that comes with tracking and sharing your spreadsheets. A few metrics here, a few metrics there, it can become a days work to find and surface the right sheets. Thanks to our friends at Sheetgo you can easily centralize and consolidate all of your online spreadsheet data across multiple Google Sheets and CSV files.
Centralize Your Data
No need to chase managers and colleagues for their spreadsheets and data on a regular basis. Using Sheetgo you can easily connect multiple Google Sheets to feed into a master sheet to have your key data at your fingertips. SheetGo is a powerful tool to build, maintain, and scale an internal data distribution system.
When connecting multiple sheets you likely won’t need all of the data points in each. SheetGo can be as powerful or simple as you would like. Use their filters to determine what data you will be bringing in from each sheet or use personal queries to customize the process to your needs.
Outside of centralizing your team’s data help your clients, board, and investors stay on top of key data with consolidated sheets. Running ad campaigns on multiple platforms for a client? Easily take the data exports and centralize all of their vital data into one sheet.
Visualize & Distribute
Once you have your Sheetgo connections in place connect a single sheet to Visible to visualize and distribute your data. As you continue to update the individual sheets fueling your “master sheet” your charts, dashboards, and Updates will automatically refresh in Visible as well. Using a combination of Visible & Sheetgo it has never been easier to stay on top of your spreadsheets and avoid the frustration that comes with hunting down your data.
Ready to simplify your teams spreadsheets and data? Check out Sheetgo and let us know what you think.

founders
Hiring & Talent
Operations
Metrics and data
Operations
Startups: Why Send Management Reports?
Successful companies share a few key traits… so do unsuccessful ones. Investors, executives, team members, potential hires, etc. understand this. Regular management reports show the CEO/CFO/etc. are key in keeping business decisions agile while showing you value what your management team brings to the table.
How Can You Get Started with Successful Management Reports?
It’s a lot easier than you might think. Good management reports don’t have to be long and they don’t have to be time consuming. If you’ve already got metrics, KPIs, etc. in place with your teams it is a matter of extracting the key data and turning it into something easily replicable, actionable, and digestible. Sharing financials, metrics, and dashboards can certainly be useful to managers but suffocating at the same time.
Bringing clarity and simplicity to management reporting is a strong start to avoid “the activity trap” and keep managers, teams, and individuals focused on their original purpose. It is easy for team members to get lost in their day to day and ultimately forget why they joined your company to grow the company and themselves. In working with countless CEOs, CFOs, and managers, we have a few things to keep in mind while building your management reporting and data distribution system:
Replicable – Keep metrics and objectives comparable from report to report. Chances are you’ve got an objective in place so be sure to highlight that in every report to keep focus where it matters most.
Actionable – Be sure that the report leaves room for questions, discussions, and a game plan until your next meeting, report, etc.
Digestible – Make the report light and to the point. Be sure to include only the 2-6 most vital metrics as full dashboards and spreadsheets can become suffocating and distract from your manager’s main objectives.
An Example Management Report
You can check out an example of a Visible Management Report Here.
As always, feel free to sign-up for a free trial here and email support@visible.vc if you’d like the template dropped into your account.
founders
Metrics and data
Product Updates
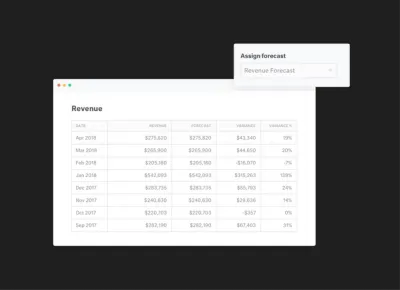
Using Variance Reporting in Visible
Use Variance Reports to Determine How You’re Tracking to Your Projections
How are we doing? Are things going to plan? Are we overspending? Underspending? Where should we double-down? Cutback?
These are all questions that you’ve likely encountered in a management meeting or recent board meeting.
Today we are excited to announce new Variance Report module that will be part of our insights layer. Variance reporting will let our customers quickly assign any of their KPIs to a forecasted or budgeted value and with one-click get back a full Variance Report.
We’ll calculate the following in your Variance Report:
MTD Variance
MTD Variance %
YTD Actual
YTD Variance
YTD Variance %
YTD Actual
prior yr YTD Actual
prior yr YTD Variance
prior yr YTD Variance %
Our budget vs actual and variance reporting will give you instant insights and reporting capabilities for any of your metrics in Visible. Being able to make timely decisions based on your forecasts and budget will help accelerate growth, manage your bottom line and hit goals across your organization. Utilizing the variance report in Visible is great for:
Weekly team updates showing progess towards your Monthly and Annual Goals
Crafting monthly management reports to your leadership teams providing feedback on where you under/over performed
Creating pre-board meeting reports that give a health check on where you are compared to board approved budgets.
We hope you enjoy! Sign in to Visible to get started to or sign up! Feel free to email support@visible.vc with any questions, comments and feedback.
Up & to the right, The Visible Team

founders
Metrics and data
Top Down vs Bottoms Up Projections
Financial projections are essential for any business, even if it’s not yet generating revenue. A variety of specific methods exist for performing this task, but they can generally be classified into top-down and bottom-up approaches. Financial analysts often use both methods as checks upon each other.
Top Down Projections
A top-down method of estimating future financial performance uses general parameters to develop specific projection numbers. You’ll often use a top-down approach to determine the market share that your new business can expect to receive. You might start with the market value of your product, narrowing it down to a particular location as much as possible. You would then assume that your business will receive a specific portion of that market and use that estimate to generate a sales forecast.
A top-down approach is comparatively easy since the only parameters it really requires is the total market value for your area and the market share you expect to receive. This method is most useful for checking the reasonableness of the projections resulting from a bottom-up approach. However, top down projections aren’t recommended for preparing detailed forecasts.
Example
Assume for this example you plan to open a business in an area where the total annual sale value of your product is $2 billion. You believe that your business might get 0.01 percent of that market, resulting in annual sales of $200,000. Note that your financial projection is entirely dependent upon the accuracy of your estimate on the product’s market value and your market share. Furthermore, the top-down approach doesn’t you to ask “what if” type questions.
Bottoms Up Projections
The bottom-up approach uses specific parameters to develop a general forecast of a business’s performance. This method might start the number people you expect to pass by your business each day, also known as footfall. You would then estimate the percentage of footfall that will enter your store and make a purchase. The next step is to estimate the average value of each purchase to project your annual sales. Bottoms up projections are based on a set of individual assumptions, allowing you to determine the impact of changing a particular parameter with relative ease.
You may use a bottom-up approach to select a location for a new business. You can obtain an accurate estimate of the footfall by direct observation. You can also observe similar stores in that area to estimate the percentage of footfall that are likely to enter your store. The prices that your competitors charge will give you a good idea of the price you can expect to charge.
Example
Assume for this example that an average of 10,000 people pass by a particular location each day. About one percent of this traffic in this area enters a store and makes a purchase, and the average total of each sale is about $5. The expected annual sales revenue in this example is therefore 10,000 x 0.01 x 5 x 365 = $182,500. You can then refine this estimate by considering additional factors such as price changes, closing on weekends and seasonal fluctuations.

founders
Metrics and data
Making Changes to Your Cash Flow Projections
No founder has ever created a financial plan and cash flow projections they didn’t like. But what happens when the countless hours spent sifting through data, building models, and pitching your projections don’t go as planned?
There is endless content on putting together accurate financial projections and cash flow analysis but the reality is companies are still going to have down quarters, overly optimistic forecasts, and miss your projections one way or another. However, it is something that can be handled immediately with a few quick readjustments.
When to Readjust your Cash Flow Projections
As we mentioned above, no founder has created a forecast they did not like. There is a fine line between an optimistic and delusional projection. If you’re continuing to miss your forecast, have limited resources, etc. it is probably time to readjust your forecasts. For earlier stage companies, start with your life-blood; cash flow.
“Cash flow forecasting is important because if a business runs out of cash and is not able to obtain new finance, it will become insolvent. Cash flow is the life-blood of all businesses—particularly start-ups and small enterprises.”
Cash flow can be extremely delicate in the early stages of a company’s life. Being off by just a few weeks or months can make or break moral, investor interest, and the life of the business.
As Jason Lemkin puts it after a missed quarter, “If your cash is now going to stretch 12 months instead of 15, you may need to take action now. If you wait — it will be too late to make a difference. Do not wait a quarter here. Do this now.”
If revenue is down, chances are you are closer to your zero cash date and need to make sure this is accounted for. You will likely need to re-forecast your cash and financial projections for the year as well.
How to Readjust – A Dynamic Forecast
A quick and easy way to keep your projection in check? A last three to six month rolling projection simply using your growth rate and burn rate. What exactly is a “Last Three Month” model? You’ll just need to take the average of your last three (to six) month growth rate and roll it forward 12 months. While it may not be as appealing as a forecast you put together on your own it is generally a great indicator of where your business is heading.
Example from SaaStr.com
As you can see in the example above from SaaStr, the average growth rate over the last 4 months is 14.7% so they use that as their growth rate moving forward. As your new revenue and growth rates continue to change so will your rolling average and forecasts.
Chances are this will be the most realistic forward looking growth rates as well. However, you can still pair a “Last Three Month” model with your original forecasts so you have a more realistic and a “stretch” forecast to keep an eye on.
Start automating your cash flow projections using our business intelligence layer by signing up for a trial at Visible.vc

founders
Fundraising
Metrics and data
Debt vs Equity Financing
What is debt financing?
Startups are in a constant competition for 2 resources; capital and talent. When it comes to raising capital for your startup there are quite a few options. Outside of bootstrapping, debt and equity financing are 2 of the most popular options.
According to Investopedia, “Debt financing occurs when a firm raises money for working capital or capital expenditures by selling debt instruments to individuals and/or institutional investors. In return for lending the money, the individuals or institutions become creditors and receive a promise that the principal and interest on the debt will be repaid.”
On the other hand, there is equity financing.
How does debt financing work?
A lender is generally evaluating if and when a business can be repaid. A team of lenders will generally evaluate a few things, this generally starts with past performance and future projections. A few keys to understand when approaching a lender or bank for debt financing:
Complete financial statements and documents. Poor or incomplete financial statements can put doubt in the mind of a debt-provider. Most debt-providers will look as far back as 2-3 years. For example, Lighter Capital will occasionally make investments with ~6 months of solid financials.
Understand your business. Have a deep understanding of where your customers, how you’re acquiring them, and why they are churning.
Revenue Growth. You don’t have to be a profitable company to receive funding from Lighter Capital but should have a clear plan and pathway to profitability.
Downside Scenarios. As mentioned above, debt-providers are focused on repayment as opposed to extreme upside. Make sure you lay out downside scenarios to show you can navigate down periods.
High Gross Margins. Going hand in hand with “downside scenarios” show debt-providers you have high gross margins and can limit the downside as much as possible.
Story matches the numbers. If you’re telling a great narrative and the data/financials are not matching up with the story chances are that will cause doubt in the mind of the providers.
Plan for New Capital. Show you have a plan in place for how you will allocate your new capital. Allen of Lighter Capital has seen a clear connection between a company coming to them with a solid plan and their future growth.
Pros of debt financing
Every financing option will come with its own set of pros and cons. Check out a few of the key pros of debt financing below:
Maintain ownership — debt financing does not require founders to give up equity or ownership in their business
Efficient growth — taking on debt can allow companies to buy the resources and hire the talent they need to fuel growth
Tax benefits — As the team at Lightspeed put it, “A strong advantage of debt financing is the tax deductions. Classified as a business expense, the principal and interest payment on that debt may be deducted from your business income taxes.”
Cons of debt financing
On the flip side, there are cons to debt financing. Check out a few examples below:
Repayment — of course, you’ll need to repay the debt. This requires a predictable business model.
Collateral — debt also requires collateral. This can be limited to early-stage companies.
Types of debt financing
There are different types of debt financing that startups can leverage. Check out a few types of debt financing below:
Bank Lending — The most traditional form of debt financing requires taking a loan from a traditional bank or institution.
Recurring Revenue — There are specific lenders dedicated to recurring revenue business models (SaaS).
Family or Friend Lending — Startup founders can also take on debt or loans from family members or friends.
What is equity financing?
According to Investopedia, “Equity financing is the process of raising capital through the sale of shares. Companies raise money because they might have a short-term need to pay bills or they might have a long-term goal and require funds to invest in their growth. By selling shares, they sell ownership in their company in return for cash, like stock financing.”
When thinking of equity financing in terms of startups we generally think of venture capital and angel investors. When a startup goes out to raise a funding round, they are selling shares (AKA equity in the company) for a set amount of capital.
How does equity financing work
When raising equity financing or venture capital it often follows a process. This involves the founder focusing on the fundraise.
Finding the Right Investors
To start a fundraise, you first need to understand what investors you should be talking to. A venture fundraise is time intensive so it is important to make sure you’re spending your time with the right people. Check out our investor database to find the right investors for your business here.
Related Resource: An Essential Guide on Capital Raising Software
Pitching Your Company
Once you land a meeting with a potential investor you will need to pitch your business and make it a point for them to invest. As we wrote in our Fundraising Guide, “If you’ve done your research and asked the right questions, you’ll be armed with the information you need to effectively pitch your company. At the end of the day, pitching is storytelling and it is your job to figure out how each potential investor fits into the narrative. If done correctly, you’ll be able to control the conversation and better your chances of setting future meetings.”
Due Diligence
If you are fortunate enough to gain interest from a venture capitalist they will perform due diligence to confirm what you’ve been pitching is true. This means they will be calling on customers, other investors, and combing through historical data to confirm they’d like to make the investment.
Pros of equity financing
Like debt financing, equity financing comes with its own set of pros and cons. Check out a few of the pros of equity financing below:
No Loan Repayment — With equity financing, the burden of repayment does not fall on the shoulders of a founder. In turn for giving up ownership, they are giving up the burden of repaying debt.
Resources — Many equity financers, like venture capitalists, come with resources to help startups grow and scale their operations.
Cons of equity financing
On the flip side, there are also cons that come with equity financing. Check out a couple of examples of the cons of raising equity financing below:
Loss of ownership — Giving up equity means that founders are giving up ownership and potentially decision-making powers.
Expectations — When adding on new shareholders, chances are they will have requirements and expectations that may not align with your own.
Types of equity financing
Equity financing, and the individuals/firms that support it, come in different shapes and sizes. Check out a few examples of equity financing below:
Venture Capital — dedicated firms built to invest in high-growth startups
Angel Investors — high net worth individuals that use startup investing as a way to diversify their investment portfolio
Private Equity — Professional investment firms dedicated to helping operate and scale large startups.
Related Resources:
How to Find Investors
How to Effectively Find + Secure Angel Investors for Your Startup
Private Equity vs Venture Capital: Critical Differences
Debt vs equity financing for startups
When evaluating debt and equity financing there are a few key major differences that a startup and founder have to evaluate.
The Cost
The major difference when evaluating debt and equity financing is the cost to your business. On one hand, you can take debt financing and will need to pay back the interest rate and principle at a later date. This generally assumes that your business is bringing in some type of predictable revenue. There is a clear cost associated with paying this back.
On the flip side, is the cost of equity financing. While there is not a set amount of capital you will need to pay back you will eventually need to pay the cost of the shares at a later date. This can be expensive if the business turns out to be worth a large amount.
The Business Model
When understanding debt vs. equity financing you need to understand the impact your business model will have on each as well. When raising debt financing, the lender will want your business to have predictable revenue and clear projections so they know that they will be repaid.
On the other hand, equity financing allows small businesses to pursue a new market where they may have little to no data. This is because someone buying equity, especially a venture capitalists, are investing in the future value of the company and the ability for the team to execute on the vision.
When to seek out debt vs equity financing
As we’ve discussed earlier in this post you need to understand the costs associated with both equity and debt financing.
Securing Debt Financing
For those who aren’t growing at 300% but rather 150% or 200% a good option would be to look into debt financing. While there are countless types of debt financing, Lighter Capital focuses on “revenue-based financing”. There are several factors that Lighter Capital looks into when evaluating a potential investment but as Allen Johnson of Lighter Capital puts it, “At the end of the day they’re assessing the risk to get repaid”.
Securing Equity Financing
To kick off the webinar, Mike discussed experiences from Visible’s own fundraising efforts and what we’ve seen from our partners and countless companies using Visible for investor relations.
The biggest takeaway from raising equity financing? It is very much a process and can be very time consuming. Raising equity financing is essentially a full time job for the CEO or founding team. It is not something that can be done lightly and viewed as a “side project”. You need to build relationships and a pipeline of investors, show momentum, generate inbound interests, etc.
Equity financing allows pre-revenue companies with a strong vision and adjustable market an opportunity to secure capital and pursue their vision. Investors are expecting a return and are often in pursuit of an “extreme upside”. As you can see below, Christoph Janz of Point Nine Capital breaks down what it takes to raise a Series A in SaaS below:
Basic Info and Docs You’ll Need While Raising Venture Capital:
As part of the process of raising venture capital, VCs will need to understand your past business performance. Venture capitalists are generally investing in a highly experienced team, intriguing and emerging market, and/or a world class product.
Related Reading: Building A Startup Financial Model That Works
With that being said, they will generally need a few of the info and docs below to evaluate their investment decision:
Legal Docs, Cap Table, Financials, etc.
A venture capitalist will want to see who owns the business and how it is structured. They will want to see the cap table to understand this. They will also want to get a look into historical financials to understand how the business is burning cash and handling their finances. In the wake of recent VC failures, it is especially important to have cash burn and financing under control.
Trends over time
VCs are largely investing in the founder and the team if there is little to no revenue or historical data. It is important that the founder and team takes the relationship and transparency seriously. A regular cadence and rapport leading up to the investment. Investors won’t make an investment in a single point of time.
Customer Acquisition Model
VCs will also want to understand your customer acquisition model and the sustainability of it moving forward. If it costs more to acquire a customer than they are paying, it is likely not a feasible business. To learn more about customer acquisition models, check out this post.
Total Addressable Market and Sensitivity analysis
If a business has little to no historical data, a VC may want to better understand the market they are investing. If a market has the opportunity to be large and the investment has the opportunity to penetrate a large percentage of the market, it may be an interesting investment. You can learn more about modeling this and sharing TAM with investors here.
Both debt financing and equity financing are solid options depending on your stage, metrics, and financials. Each has its pros and cons for each company. It is ultimately up to the founder to have a deep understanding of their business to make sure they are making the right decision for their business.
The Visible newsletter brings you weekly, curated fundraising news, articles, and events
Every Thursday we deliver curated insights to help founders raise capital, update investors, and track their key metrics in our newsletter, the Visible Weekly. Subscribe to the Visible Weekly and stay in the loop with fundraising data and insights here.

founders
Metrics and data
Pull Levers in your Sales Funnel with Product Qualified Leads
Product Qualified Leads (PQLs) have become a major trend in SaaS companies over the last couple of years. Why the shift to the new framework? I have two thoughts. 1) The way organizations sell and market their products are different and 2) business software continues to look more and more like consumer software.
We’ve scaled Visible to hundreds (soon thousands) of paid customers with a lean team through adopting a Product Qualified Lead framework.
Disclaimer: Product Qualified Leads may not fit into every business and organization as some solutions may require intensive initial implementation or for strategic reasons the end-user never gets to try the product. Typically these are high ACV products.
Regardless of your business, I hope you still get some value from this post and takeaway parts you want to use in your own processes. My goal is to get you walking away thinking how a Product Qualified Lead framework can increase efficiencies cross sales, marketing, customer success and finance, and product.
The “old” way
If you’ve attended any sales or marketing conference, seminars or training sessions you’ve likely heard someone beat the BANT (Budget, Authority, Need, Timing) drum. It is a matrix provided to make sure you are spending your resources on the right leads. It looks something like this:
Paired with the BANT framework is usually the idea of the Demand Generation funnel. It looks something like this usually:
Both of these frameworks work off one another. Typically you’ll have marketing initiatives to drive leads. This might be paid advertising, webinars, downloadable content or having business development representatives (usually called BDR’s or if you are fancy “Solutions Consultants”).
Once you get a download, opt-in, etc you’re likely to consider that person a Marketing Qualified Lead (MQL) where they might be nurtured with a steady drip of content, get contacted by a Inbound BDR to qualify them some more, etc. This is where you are trying to understand the BANT for a lead to see if they should be moved to Sales Qualified Lead (SQL).
Then you might have an Account Executive accept the SQL to do their own qualification, provide a demo and truly understand the lead’s BANT. If the AE accepts the SQL it will likely be converted to an Opportunity, worked and hopefully closed from there.
Now there is nothing wrong with this framework at all. It’s deployed by tens of thousands of companies and for metric/forecasting junkies it provides a great way to measure ROI across all of your activities. However, if you layer a PQL framework into your current you can allocate resources even more effectively across your business in addition to have another growth lever to pull.
What are Product Qualified Leads?
Product Qualified Leads are potential leads using some version of your current product that take some sort of action. Typically this is some sort of trial or freemium experience.
Defining PQLs are ultimately up to you as engagement for every business is different. E.g. Slack’s magic number is 2,000. Slack knows that if they can get you to send 2,000 messages there is a great chance they’ll get you as a customer.
At Visible, our PQL criteria is as follows:
Connected 2 or more data sources
Created 1 chart
Published an Update
Invited a colleague
If you do those actions, there is a 90% chance we will get you as a customer (if not within the trial then within 90 days).
With most frameworks, testing and iterating is crucial here to get you to zero in on your PQL qualifications. E.g. our original PQL definition was just one data source but found our customers value bringing in multiple data streams so wanted our PQLs to reflect that.
Improving Marketing
You likely nurture your leads based on who they are and what they have downloaded. Shouldn’t you do the same with PQLs? What about prospects who are not yet a PQL? Can you effectively drip them helpful content while they are on a trial? The answer is yes to all of the questions.
If you have a definition of your PQL there is no reason why you shouldn’t have dynamic product marketing to go alongside it. E.g. if a lead has taken actions A & C but not B. I’d make sure that your email is geared towards making sure they do B. Whether it is social proof from a customer case study or an AE calling to offer a hand.
Hint: Intercom + Segment is great for this.
Improving Sales
PQLs can help in a lot of areas in your selling organization. The biggest impact (in my opinion) is around where AEs can dedicate their valuable time.
Demo Conversion: According to Tomasz Tunguz, “When the sales team calls PQLs, customers typically convert at about 25 to 30%”.
If you are calling on customers who are already PQLs this is a great way to have a more meaningful conversation. They have already had a chance to use your product, will have specific questions and overall be a much more engaging conversation.
Hubspot and Openview touch on “In Product Hand Raisers” in Why Product Qualified Leads are the Answer to a Failing Freemium Model stating that “Hand-raisers can convert at 2x-4x the conversion rate of traditional MQLs.”
In Mitch Morands’s post, “MQLs are DEAD! Enter the PQL “Product Qualified Lead” = 10X+ revenue impact” he states that PQLs convert 10X+ more revenue than MQLs
I’d argue “Need” and “Timing” are identified in BANT through PQLs. You can quickly see how they are engaging with your solution and typically your trial with have a some sort of end date. How many times have your AEs sat a demo where they prospect said “This is awesome, hit me back in 9 months when we are looking to deploy. I’m just doing some research right now”
Improving Product & Engineering
Getting your team rallied around PQLs will help prioritize the product roadmap, create focus within the product and make sure your onboarding is buttoned up.
Related: Check out our new Contextual Help Guide we just launched to help new trialers get to PQLs faster.
Improving Customer Success & Support
There is a great proverb that relates to customer success and product:
“If you catch someone a fish, you feed them for a day. If you teach them to fish, you feed them for a lifetime”
By focusing on PQLs, we make sure our customers can get in and use the product from when they sign up. If they get stuck we make sure we have a great knowledge base, help resources and more. If they are really stuck, we are always happy to get a quick screen recording or demo setup with a customer.
This has mentality has created less customer support issues which means our median response time is 5 minutes. It also lets our customer success team be proactive to help leads get into a product qualified lead state.
Improving Finance
There is no shortage of ratios that PQLs can help improve. Customer Acquisition Cost, Time to Close, Lifetime Value, Trial to Close %, etc. Focusing on creating PQLs will help all of your metrics become more attractive.
Bottomline
PQLs provide a great way to align everyone in your organization. The product team gets to focus on building a great product, the sales team can spend their team on highly qualified leads and the marketing team can dynamically nurture leads.
Don’t ditch MQLs, SQLs or your current process. Just try segmenting them with PQLs to increase conversions in all parts of your business.
Try it out and track it as a metric in your Visible account 😉
Up and to the Right,
Mike & The Visible Team

founders
Reporting
Operations
Metrics and data
Operations
An Update Template for Marketing Teams
A Weekly Email Template for Marketing Leaders
Marketing is one of the most measurable aspects of a business. With vast data points, it is important to hone in on what truly matters and rally your team behind those key metrics.
This week, we have put together an Update template intended for marketers to “report up”. Whether that be a marketing representative to manager or manager to executive, our Marketing template is intended to be standardized across the team to keep everyone moving in the same direction.
Key Metrics
Keep in mind the metrics in the template are suggestions and can be tailored to your organization’s needs. Some of our favorite marketing metrics include Customer Lifetime Value, Customer Acquisition Cost (check out this video to use formulas to create CAC in Visible), and these 5 metrics for “reporting up”.
TL;DR
A quick recap of any major milestones, concerns, and figures from the last period. Always a good idea to piggyback off of any product updates, metrics, projects, concerns discussed at previous meetings/updates.
Now Content and Campaigns
Include a brief section of any campaigns, content, and emails published from the past week. The goal here is to keep everyone in the loop and ultimately lead to conversations and improvements.
Funnel Review
A funnel is a quick way for all parties to quickly digest your marketing conversions and inbound marketing efforts. The metrics used in a funnel can be customized to any business as well. Make note of any interesting leads or trends that have noticed over the previous period.
Customer Stories
Reflect on the past period and share any relevant quotes from customers; good and bad. What is going well? What is not working? Feedback to certain emails? etc.

founders
Operations
Metrics and data
Operations
An Update Template to Align Sales + Marketing
“Most organizations still believe in the perfect sales and marketing delineation: This is where marketing generates leads for sales, sales development reps then qualify these leads, to create opportunities that salespeople hopefully turn into revenue… The new reality is that sales and marketing are continuously and increasingly integrated. Marketing needs to know more about sales, sales needs to know more about marketing, and we all need to know more about our CUSTOMERS.” – Jill Rowley – Founder, #SOCIALSELLING
As the modern buyer continues to become more informed it is more important than ever that your sales and marketing teams are aligned. It is vital that companies share the right information, at the right time, to the right person. At the end of the day, the marketing teams role is to enable sales to close more deals. A good place to start? Consistent and clear communication between sales and marketing.
This week, we put together an Update template for marketers to share with their team, managers, etc. and most importantly the sales team. The template is intended to be shared on a regular basis and lead to conversations to improve different aspects of your pipeline.
If you’d like us to drop the template into your Visible account feel free to shoot us a message to support@visible.vc and we would be happy to do so.
Key Metrics
“Enablement means something different in every company,” Katie MacDonald, global sales onboarding and enablement manager at Optimizely, said. Find the metrics that are relevant to your team and continue to share and reiterate. Get your team behind the data and constantly communicate with the sales team to find areas for improvement. Keep in mind, our template has popular sales enablement metrics in place but can be changed to your organization needs. The team at Hubspot suggests using Lead-to-Customer as your North Star.
Last Week’s Efforts
Include a brief section of any campaigns, content, and emails published from the past week. The goal here is to keep everyone in the loop and ultimately lead to conversations and improvements. Is always useful to include any success stories from reps or potential customers from the past week to help make sure everyone is getting the most out of new content.
This Week’s Efforts
A quick breakdown of content and changes for the upcoming week. Briefly highlight the goal of the content and where/when it should be used. Most importantly – leave a place for the sales team to offer feedback and share the sentiment from the buyers they have been talking to.
founders
Metrics and data
6 Free Google Sheet Templates to Jumpstart Your Startup Reporting
As the old adage goes, “you can’t improve what you don’t measure.” When building a startup, it is incredibly important to keep tabs on the metrics, data, and financials that keep your business headed in the right direction. Building your own templates and tracking resources can be time-consuming for a busy founder. Thankfully, there are countless free templates and resources to help you get started in just a few minutes.
Check out a few of our favorite free Google Sheet templates to help you better your startup reporting below:
An Open Sourced Financial Model for SaaS Startups
In the 5th iteration of his SaaS Financial Model, Mike Simmons, the CEO of CredSimple, offers an open sourced Google Sheet template with explanations and resources for the components in the model; ranging from hiring, fundraising, and growth plans. From Mike himself:
“I decided to create an open source template so that other founders can benefit from the work that we’ve done. In this project, I have tried to thread the needle between robust and not too complicated or specific. It has been tested by several investors and MBA interns and has proven to work well. But it is up to you to adapt it for your own needs.” Read more here.
Runway and Cash Forecasting Tool
From the original post by Taylor Davidson of Foresight.is:
“This tool is used for forecast your cash and runway. It’s intended to be a simple model with easy inputs for expenses, revenues, and external funding, so that you can get a handle on burn, cash and runway quickly and easily. Input your revenues and costs, and the model will automatically create charts of your burn and runway (over 36 months), a summary of your operating expenses, and an optional sources and uses chart.”
Ecommerce Google Sheet Template
Dave Ambrose of Steadfast Capital lays out what they have found to be their most important Ecommerce metrics. A few of the major points in the template are the source for customer additions as well as the Contribution Profit (you can read Dave’s original twitter thread here). Read more on the model here.
Related Reading: Our Guide to E-Commerce Metrics (with Google Sheet Template)
Customer Lifetime Value Template
There’s a reason why many experts insist Customer Lifetime Value (we’ll use LTV for short) is the most important metric for your startup. The data points you gather for the LTV formula can help assess the overall health of your company. Not only does LTV provide insight into the long-term trajectory of your startup, but it also gives immediate insight into specific areas that need improvement. Knowing how valuable it is to gain each customer is essential.
We created a Google Sheets template that will allow you to plug in your unique numbers to calculate both your LTV and CAC. Read more here.
Related Reading: Customer Acquisition Cost (CAC): A Critical Metrics for Founders
Inside Sales KPI Template
Every company should also know the progress of their sales team, the goals they need to hit and make sure management understands the return. Don’t forget about the intangibles either. Conner Burt, Chief Operating Officer at Lesson.ly, said the long-term prospects for sales reps can often be about more than just filling a funnel.
“Your building a bench that you can use to promote sales reps to quota bearing sales people. That’s an intangible benefit.”
With this in mind, we built a simple Inside Sales KPIs template for sales teams in Google Sheets. It is flexible so you can remove any irrelevant info, manipulate it or add anything missing that fits your process. Read more here.
Key SaaS Metrics Template
For SaaS companies, finding, tracking, and measuring your key metrics is key to success. In order to help you get started with the key metrics, we’ve put together a free Google Sheet template. Our SaaS Metrics Template automatically calculates your key SaaS metrics like MRR, ACV, churn, CAC, payback period, and more. Simply enter in your new customer data and the template will handle the rest.
Related Reading: Our Ultimate Guide to SaaS Metrics
Let Visible Help with Your Reporting
Raise capital, update investors and engage your team from a single platform. Try Visible free for 14 days.
founders
Metrics and data
4 Ways to get to $100 Million in ARR
Back in April we partnered with OpenView to share our free Total Addressable Market template. With an overwhelming positive response and some inspiration from Point Nine Capital’s “5 Ways to Build a $100 Million Business [Infographic]” we wanted to build a new forecasting template on how SaaS businesses can get to $100 million in annual recurring revenue.
For this template we partnered with our friends at Foresight & OpenView to provide 4 distinct forecasting models on how a business can grow to $100 million in ARR. You can get the template here!
Getting to $100 million in annual recurring revenue is one of those SaaS benchmarks you’ll hear about frequently. It’s a line in the sand that investors have drawn to deem your business “venture-backable” or not. I’m sure many have asked or received the follow question, “That’s great, but how does this get to $100mil in ARR?”
Click here to get the free SaaS forecasting template
No two paths are the same but there are some commonalities with different go-to-market strategies that can help frame your business. We’ll break down the following markets and their respective distinct metrics:
Consumer
SMB
Mid-Market
Enterprise
You’ll be able to define your customer acquisition channels, Average Revenue Per Account, contract lengths, growth assumptions, cost assumptions and more!
We hope you enjoy! You can find the post in full at Opeview and Foresight. Integrate the Google Sheet template directly with your Visible Account as well!
Get the free forecasting SaaS template here!

founders
Metrics and data
Ultimate Report Part 3 of 4: ARR Movements
Welcome to part 3 of 4 of our Ultimate Report series. When we talk to our customers and potential customers we love to get an understanding of their “ultimate report”. It’s the report that stakeholders can quickly rally behind and understand how the business is performing, usually to a goal or target.
Part 1: Pacing
Part 2: Cadence & Operational Metrics
Part 3: ARR Movements
Part 4: Coming on July 12th
This week, our ultimate report is ARR Metrics. For any SaaS business, the movements in your recurring revenue are crucial to making decisions, hiring and resource allocation. What makes SaaS metrics great are that they are fairly easy to benchmark across industries.
Tracking Your ARR Movements
This report focuses on 4 key recurring revenue movements.
New Business ARR: When a lead converts to a customer (for the first time)
Expansion ARR: When an existing customers increases their recurring spend with you (more seats, better package, etc)
Contraction ARR: When an existing customers decreases their recurring spend with you (less seats, downgrade plan, etc)
Churn ARR: When a customer cancels their subscription and doesn’t renew.
If you want to dig into more SaaS metrics and definitions we recommend checking out our friends at ChartMogul and their SaaS Metrics Cheat Sheet. P.s. we have an awesome integration with them!
Unlock Your Investor Relationships. Try Visible for Free for 14 Days.
Start Your Free Trial