Flexible Dashboards for Venture Capital Investors (with examples)

Belle Raab

As a venture capital investor, it’s critical to maintain accurate, up-to-date information about your portfolio companies and investment data. This helps investors make data-informed investment decisions, provide better portfolio support, fulfill audit requirements with relative ease, and not to mention, impress LPs.

What’s even better than just having your data well-organized and easy to find, is when investors can seamlessly turn that data into meaningful insights that are easy to share with internal team members and stakeholders.

Below we describe three different dashboard types supported in Visible that help investors surface and communicate important updates about their portfolio.

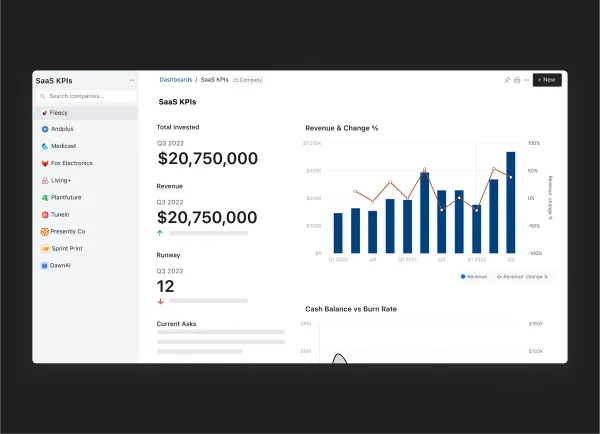
Flexible Dashboards for Internal Portfolio Reviews

Flexible dashboards in Visible allow investors to integrate metric data, investment data, and properties directly into a dashboard. The flexible grid layout means investors have control over how they want to visualize and communicate updates to their team.

Investors commonly use these dashboards to facilitate internal portfolio review meetings which keeps their team up to date and engaged about important updates across the portfolio.

View flexible dashboard examples in the guide below.

Fund Performance Dashboards for Communicating with LPs

Visible allows investors to track, visualize, and share key fund performance metrics. Investors can choose from 14+ different chart types and use custom colors to incorporate their branding into their dashboards.

The fund metrics supported in Visible include:

  • TVPI
  • DPI
  • RVPI
  • MOIC
  • IRR
  • Unrealized and realized FMV
  • Total Invested
  • Capital Called
  • and more.

Learn about the 30+ fund metrics supported in Visible.

Related resource: VC Fund Performance Metrics 101

View a Fund Performance Dashboard example in the guide below.

Portfolio Metric Dashboards for Cross-Portfolio Analysis

As a venture capital portfolio grows, it’s helpful for investors to be able to pull quick insights across all their companies. Visible’s Portfolio Metric Dashboards let investors compare performance across the entire portfolio for a single metric. This view can be filtered by a custom segment and time period. Visible also automatically calculates quick insights such as:

  • Total
  • Min
  • Max
  • Median
  • Quartiles

View a Portfolio Metric Dashboard in the guide below.

Visible’s dashboards give investors control over how they want to track and visualize their portfolio KPIs and investment data. Learn more about Visible.

You may also enjoy:
Product Updates
Product Update: Turn Emails Into Insights With Visible AI Inbox
Structured data. The holy grail of business intelligence. Structured data unlocks a realm of possibilities, from setting benchmarks to enhancing decision-making processes. Yet, in the venture capital landscape, accessing reliable, structured data remains a formidable challenge. This is precisely why we created the Visible AI Inbox. With unique features like automated metric detection and file parsing, the Visible AI Inbox stands out as a pioneering solution for portfolio monitoring. Discover how it can transform your data strategy by meeting with our team. Turning email into insights We believe that investors should spend time sourcing new deals and helping founders, not manually copying and pasting data from email 🙂. The AI Inbox helps aggregate insights that exist siloed in data, files, and updates across a venture firm. Updates from founders often stay stuck in one team member's inbox because it's too time-consuming to extract and enter the data and files into a more centralized repository. Visible AI Inbox makes this possible within seconds. Requests + AI Inbox = A Complete Picture The addition of the AI Inbox continues to advance our market-leading portfolio monitoring solution. The pairing of Requests + the AI Inbox will give investors a holistic view of portfolio company performance across a fund. Visible continues to be the most founder-friendly tool on the market. We’ll continue to build tools in existing workflows where both founders and investors live every day. How Does it Work? Visible AI Inbox works in three simple steps. Forward emails to a custom AI inbox email address Visible AI automatically maps data and files to portfolio companies Investors can review and approve content before it is saved From there, dashboards, tear sheets, and reports are all automatically updated on Visible. Learn more about how Visible AI Inbox can streamline workflows at your firm by meeting with our team. FAQ Will this be available on all plans? Visible AI Inbox is only available on certain plans. Get in touch with your dedicated Investor Success Manager if you want to explore adding this to your account. How is Visible addressing privacy and security with Visible AI Inbox? No data submitted through the OpenAI API is used to train OpenAI models or improve OpenAI’s service offering. Visible AI Inbox leverages OpenAI GPT 4 and proprietary prompts to extract data in a structured way and import it into Visible. If you’re uncomfortable with utilizing OpenAI to optimize your account, you can choose not to utilize this feature. Please feel free to reach out to our team with any further questions. These processes adhere to the guidelines outlined in Visible’s privacy policy and SOC 2 certification.
Metrics and data
[Webinar] VC Portfolio Data Collection Best Practices
Customer Stories
Case Study: How Moxxie Ventures uses Visible to increase operational efficiency at their VC firm
Operations
How to Start and Operate a Successful SaaS Company