Metric Tracking
Update Investors With Zero Human Error
Manually pulling metrics is risky. Your investors may see that one broken formula and believe it. Visible keeps your numbers updated automatically and accurately.
Free Starter Plan. No credit card.
Build Investor Trust with Data-Driven Dashboards






Your Numbers Are Only as Good as Your Last Copy-Paste
Revenue lives in Stripe, growth lives in a spreadsheet someone built two years ago, and product usage lives in a dashboard nobody outside the team has access to. Every update means pulling from each separate source by hand, and hand-built means error-prone. A broken formula, a stale export, a chart that didn’t update since last quarter, any of it can slip through, and it’s your investors who catch it.
That’s the real cost. It’s not just the time spent rebuilding the same KPI sheet every month, it’s what a mistake in your data signals. Numbers that don’t add up read as a business that isn’t watching closely enough.
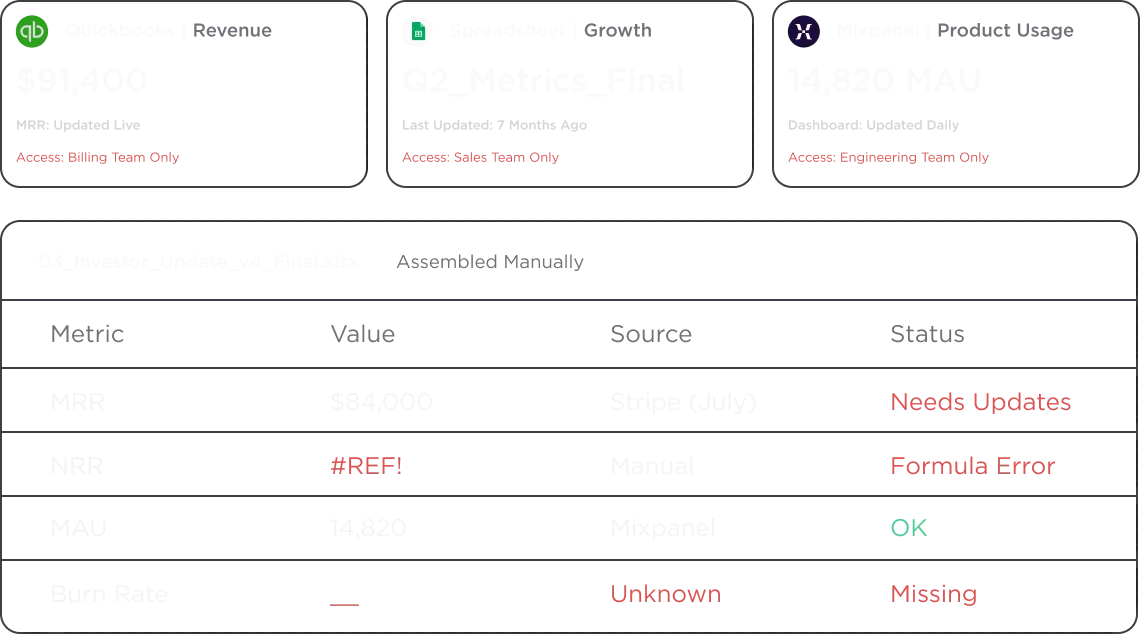
The Last Thing You Should Worry About Is If the Numbers Are Right
You’re heads-down building, and when an update goes out, you want it to show a founder who’s on top of the details, not one reconciling a broken formula at midnight. We know that pressure, and we don’t think getting the numbers right should cost you another late night.



I use Visible to update two groups of investors - current investors and new prospects. Whether it's fundraising or investor relations, it's a great tool for founders who raise outside capital.




Visible allows me to send seamless investor updates with beautifully designed live charts that get instant responses. It has made my monthly update a pleasure, not a chore.

I use Visible to update investors and it makes me look like a pro. Every month I'm reminded how grateful I am to them.




Everything Your Fundraise Needs, Wherever You Work
Connect the Tools You Already Use
Pull data in automatically from your existing stack, no manual export required.
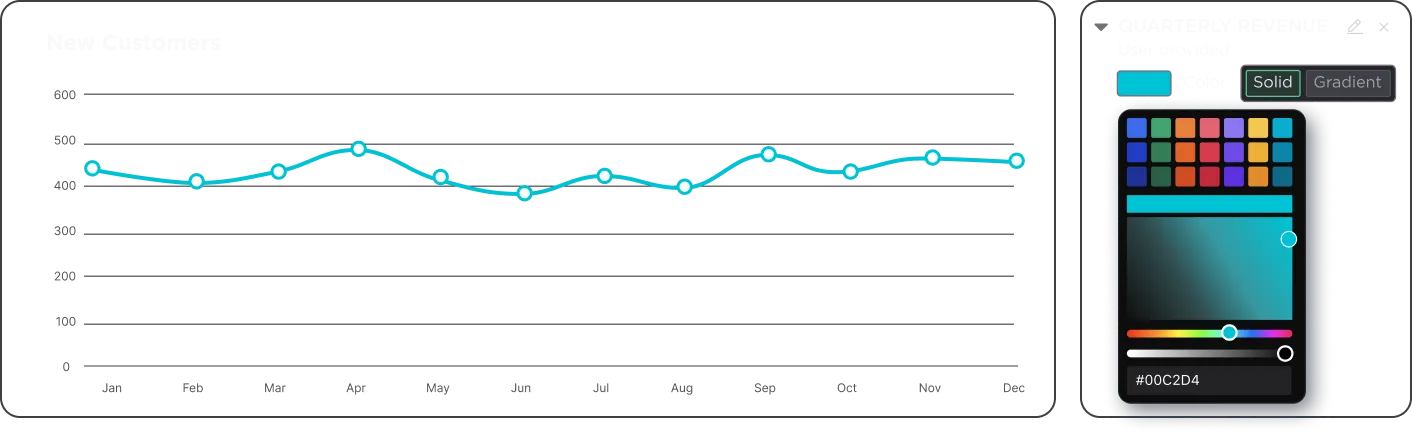
Build Charts Without a Designer
Turn raw metrics into clear, polished charts, no design skills required.
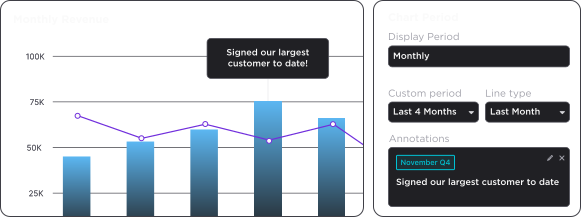
Add the Story Behind the Numbers
Add context and notes directly to your charts, so a number is never just a snapshot.
Share It Wherever It's Needed
Push a dashboard into an update, a data room, or share it as a standalone link.

Skip the Static Screenshot
Drop live charts directly into your investor updates instead of a snapshot that's already out of date.
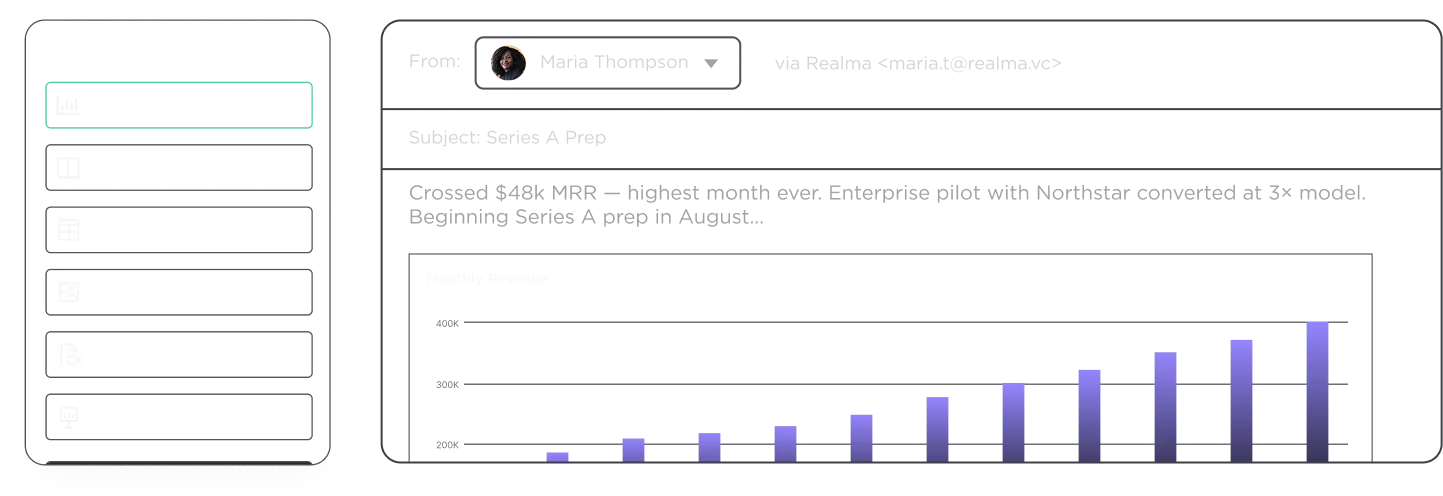
Always Current, Never Static
Every dashboard updates automatically, so what an investor sees always reflects where things stand.
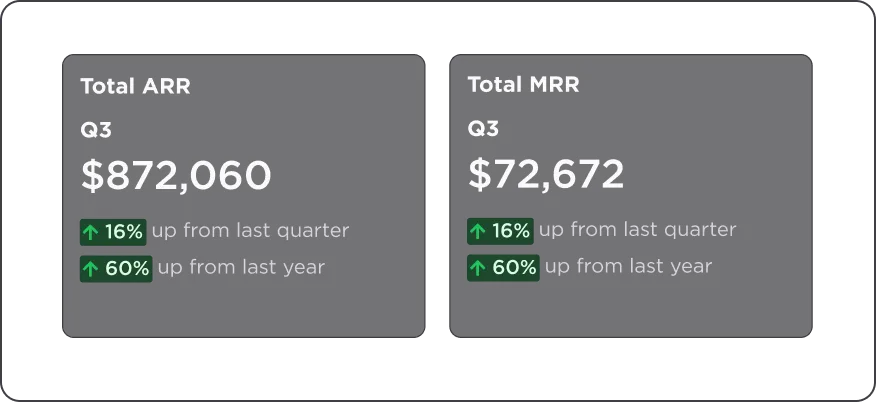
Three Steps to Numbers You Never Have to Double-Check
Connect Your Data
Pull metrics directly from your existing tools and integrations, no manual exports, no copy-paste.
Build Your Charts
Turn raw numbers into charts and dashboards with our chart editor, then add context so the story is clear, not just the data.
Share With Link
Push your data into an update, a data room, or a standalone dashboard, and it stays live and current every time someone opens it.
FAQ
What startup metrics should I track?
What metrics should I include in an investor update?
How can I automate startup metric tracking?
Update Investors With Numbers You Never Have to Double-Check
Connect your data once, and every number you share stays accurate from here on out.
Free Starter Plan. No credit card.