

As eCommerce startups begin to evolve, so do the metrics and KPIs around them. In 2020 alone, eCommerce totaled over $4.2 trillion. With the explosion of Amazon, Shopify, Casper, Warby Parker, and Allbirds, shopping online has become the norm in the United States.
As more eCommerce and direct-to-consumer (DTC) companies begin to scale and exit, the funding options and growth plans are scaling as well. In order to best launch, scale, and fund your e-commerce startup you will need to make sure you have the proper metrics and key performance indicators (KPIs) in place to track and improve.
Related Resource: Our Google Sheet Template to Track eCommerce Metrics
Related Resource: 20+ VCs Investing in E-commerce and Consumer Products
Related Resource: Top Trends and Leading VCs Investing in D2C Brands: A Comprehensive Guide for 2024

Defining Metrics According to eCommerce
Tracking and monitoring metrics across the eCommerce sales & marketing funnel is vital. With thinner margins, a larger customer base, and less predictability than a software company, there are countless touchpoints and conversion points that eCommerce leaders need to keep their eye on.
Metrics are used to measure the overall health of your business. While some metrics can fall into the “vanity:” category, there are certain metrics that should be monitored and tracked to ensure your business is healthy. We’ll continue to dig into the most vital metrics for eCommerce metrics to track later in this post.
Defining Key Performance Indicators or KPIs in eCommerce
On the flip side, there are key performance indicators (KPIs) that can be tracked and monitored for an eCommerce startup. KPIs should be used to track individual objectives for your business that you believe are crucial to growth and success.
KPIs should be periodically updated and reviewed to make sure they are relevant to your most recent objectives. As the name implies, they should be “key” to the success of your business moving forward.
Related Resource: The Startup Guide To Building Successful OKRs (Examples Included)
KPI vs. Metrics: What’s the Difference?
As we previously mentioned, KPIs and metrics can have slightly different meanings and importance for your business. While metrics are something that naturally evolve and are tracked, they are generally used to measure the overall health of your business. Different metrics will have different levels of importance. Some metrics might be considered “vanity” metrics while others might be crucial to the success of your business.
On the flip side, we have KPIs that are intentionally picked and tracked to improve certain aspects of your business. KPIs are generally tied into a specific objective or goal for your business and is something you are focused on improving for periods of time.
As the team at BrightGauge puts it, “Let’s start with a basic tenet: metrics support KPIs. KPIs may be made up of a variety of different metrics that give you a full picture of your team’s progress toward a goal.
If the business goal is to create 20% more sales qualified leads (SQL) over the next year, original/new website visits alone may not provide you with the data you need. However, understanding how that metric translates into other site interactions, like form completions and downloads, is vital. If the analysis has created a correlation between downloads and SQLs, then website visitors and new downloads become KPIs rather than just metrics.”
How is eCommerce Success Measured?
Nowadays almost anyone can launch an eCommerce site but the key is to understand your customers and be able to make strategic decisions based on evidence. This evidence and your overall eCommerce success is measured through KPIs and various metrics. Also, it is important to understand that not all metrics are as valuable as others. Identifying the right KPIs to track will help you improve the overall success of your eCommerce business.
The Best eCommerce Metrics to Keep Track of
There are various metrics you can use to keep track of your success but this may vary based on the company. For most, we have seen these metrics be key and we’ve broken them down by categories:
- Customer Breakdown Metrics (Impressions, Reach, Engagement), Acquisition Metrics (Email Click-Through Rate, Cost Per Acquisition or CPA, Organic Visitor Acquisition Rate, Social Media Engagement)
- Customer Behavioral Metrics (Shopping Cart Abandonment Rate, Checkout Abandonment, Micro to Macro Conversion Rates, Micro to Macro Conversion Rates, Average Order Value or AOV, Sales Conversion Rate)
- Customer Retention Metrics (Customer Retention Rate, Customer Lifetime Value or CLV, Repeat Customer Rate, Refund and Return Rate, Churn Rate)
- Advocacy Metrics (H4 Net Promoter Score, Subscription Rate, Program Participation Rate)
A few years back Dave Ambrose, Managing Partner at Steadfast Ventures, shared a template full of KPIs for eCommerce startups and founders. Since Dave’s original template, we’ve surveyed a few of our customers and friends to make some tweaks and add in new metrics. Special thanks to Dave and the team at Italic for allowing us to share their key KPIs. Italic is an eCommerce company that sells “unbranded luxury goods straight from the source.” With $13M in venture funding and customers across the globe, it is vital for Italic to keep a tab on their metrics across the funnel.
Check out our Guide to E-Commerce Metrics (with Google Sheet Template)!

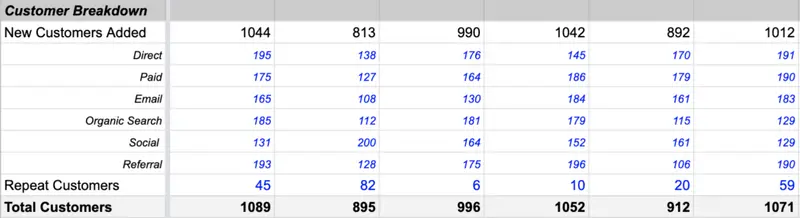
1) Customer Breakdown Metrics
Impressions, reach, and engagement track different elements of how your content is coming across to your audience (how many people see it, how often they see it, and how much they engage with it).
These metrics are important to track because it allows you to track your return on investment (ROI) and give you a clearer understanding overall of how well your content is performing.
Impressions
Impressions measures how many times your content showed up in front of someone’s eyes, regardless of whether they interacted with it or not (i.e how many times your ad showed up in their feed). Even if the same person saw it twice it would be recorded as two impressions.
Possible tools: Sprout Social, and Google Analytics, (can view total Web impressions).
Reach
Reach on the other hand tracks how many people saw your content- the qualification here is that the view is unique and every person is recorded only once. So even if the ad in someone’s feed showed up multiple times the reach would still be counted as one.
Possible tools: Sprout Social and Hootsuite
Engagement
This metric reveals how people are interacting with your content. Whether it be through a click, like, comment, or reshare- any and all interactions are recorded.
Possible tool: Hootsuite.
Acquisition Metrics
Acquisition metrics give you insight into how your social channels, content, and ads are performing in terms of customer acquisition.
Email Click-Through Rate
Click-through rate is a metric that tells you the percentage of people who clicked on a link within the email out of how many people opened it, to begin with. A click rate on the other hand measures this based on how many people were sent the email vs how many people opened it (the CTR).
Possible tool: Campaign Monitor
Cost Per Acquisition or CPA
When using a cost per acquisition model you paying for every action that your audience is completing whether that be a form submission, download, or sale. In short, if they click and convert from your ad you pay. Marketers prefer this method since you only need to pay once your customer completes the desired action.
When you are able to break down what your cost is per acquisition you are able to most accurately measure whether the content you creating is compelling enough for people to convert/ to what extent your audience wants to engage with it.
Possible tools and methods to track:
- Generate link codes for affiliate marketing or social by utilizing UTM parameters
- CRM systems such as Hubspot
- Using AdWords to export PPC campaign data
- Building custom links using promotional codes for internal campaigns
- When submitting an action add a form field asking how your customer found the campaign
Organic Visitor Acquisition Rate
When someone lands on your website from an unpaid source (google/ any search engine) then this is considered organic traffic and results are driven through SEO (search engine optimization).
Landing Page Traffic gives you insight into the top pages that people are arriving at your website from. This lets you know what topics people are interested in and how well your pages are performing for SEO. Looking at bounce rates and session durations is also important to understand how engaged people are with your articles.
Possible tool: Insider and Google Analytics
Social Media Engagement
Tracking social shares, followers, comments, and likes is a good way to monitor how engaged your audience is with your social media content.
This is why there is a focus on creating quality content. If people like what you’ve created they are more likely to want to engage with your content, brand and eventually share it with their followers.
You can keep track of which channels and content are producing the most shares and convert them into leads. Then spend more time on the channels and types of content that your audience is engaging with most. Strong social signals also help you rank higher organically within Google.
Possible tools: Sprout Social, Hoosuite, and Falcon.io
Customer Behavioral Metrics
Customer behavioral metrics can give you some of the best insight into how customers are responding to your UX/ UI experience as well as your brand/ company. Monitoring their behavior and adapting to changes that might need to be made to help influence decision making, keeps you one step ahead and able to repeat mistakes that cause your customers to convert.
Shopping Cart Abandonment Rate
The shopping cart abandonment rate is the percentage of your customers that added goods to their cart and left before checking out.
Possible tools: Google Analytics allows you to set up cart abandonment tracking and Google sheets to set up cart abandonment measurement. Bolt’s article on how to set both of these up
Checkout Abandonment
Then there is checkout abandonment which is different than shopping cart abandonment because it tracks how far along in the checkout process a customer gets before they decide to leave. If they’re not advancing in the checkout process then they are essentially abandoning their shopping cart.
Micro to Macro Conversion Rates
Micro and Macro are the two main types of conversions (when a customer follows through with an action that you want them to take). Just as it sounds, a micro conversion is when a customer takes a small step or a macro- big step to converting. A micro conversion could be someone clicking a link or following you on a social channel. Whereas a macro conversion would be a customer taking the biggest step which is completing a purchase or creating an account.
Possible tool: Hotjar
Average Order Value or AOV
The average order value is the average amount that your customer spends each time they place an order. You can calculate this by dividing the total revenue by the total number of orders.
Sales Conversion Rate
This metric lets you know how many of your visitors or leads you are converting into sales (or any action that you want the user to take).
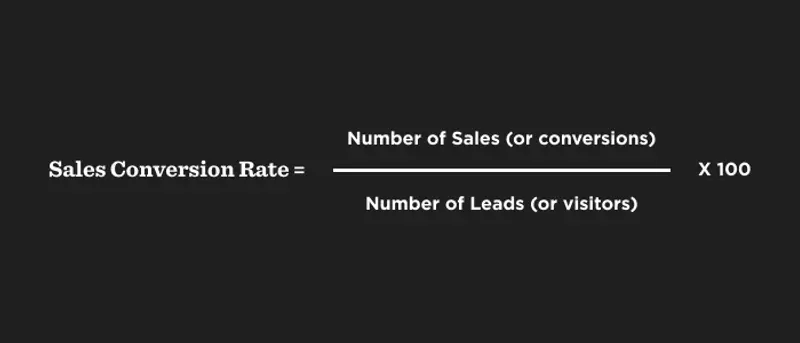
Sales Conversion Rate= Number of Sales (or conversions) / Number of (qualified) Leads(or visitors) *100
Customer Retention Metrics
Customer Retention metrics are important to track and always try to improve upon since new customer acquisition is more expensive and harder to obtain than keeping the customers you have happy and ensuring repeat business.
Additional resource: Hubspots 10 Customer Retention Metrics & How to Measure Them
Customer Retention Rate
A companies customer retention rate measures how many of your overall customers are repeat customers (someone who has purchased from you again).
Companies often incentivize this through loyalty programs, subscriptions and other incentives. Keeping customers happy also increases this rate which is why customer feedback surveys can be helpful as well.
Possible tools: Segment
Additional resources: Hubspots 6 Customer Retention Systems (& Why CRM Should Be One of Them)
Customer Lifetime Value or CLV
CLV indicates how valuable a customer is to you not just on a per purchase basis but over the entire period of your companies relationship with them(the revenue that one customer generates). If a company is able to increase this value is a huge growth driver.
Possible tools: ChartMogal and Hubspot (both are integrations that can be found within Visible- check out all our integrations here)
Additional resource: Hubspots How to Calculate Customer Lifetime Value
Repeat Customer Rate
Repeat customer rate gives you the percentage of customers that have made a purchase more than once.
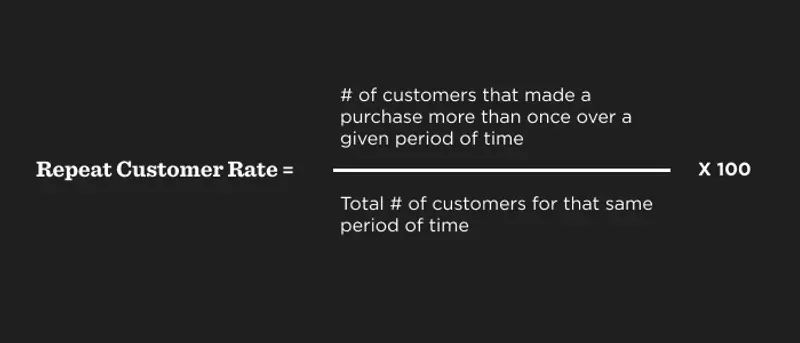
How to calculate:
Repeat Customer Rate = the # of customers that made a purchase more than once over a given period of time / your total number of customers for that same period of time. Then multiply that by 100 to get the percentage.
Possible tools: Shopify and Stripe
Refund and Return Rate
The refund and return rate can be calculated as a percentage that shows how much was returned or refunded by customers who initially purchased your services or goods versus the total number that was sold within a certain period of time.

How to calculate:
Refund and Return Rate = total number returned / total number sold x 100
Churn Rate
Churn rate is also known as customer churn, is a metric that calculates the rate at which customers stop doing business with a company. Most often this relates to subscribers who discontinue their plans within a given time frame and is represented as a percentage.
Possible tool: ChartMogal
Additional resource: Our Ultimate Guide to SaaS Metrics
Advocacy Metrics
Advocacy metrics are important to the companies that want to put their customer first and provide solutions and strategies that fulfill their customer’s needs. Some companies even hire a customer advocate who analyzes the needs of their customers and helps to build a business strategy around that. Tracking the following metrics will also help give you insights into this.
Net Promoter Score
NPS is used to gauge the loyalty of a firm’s relationships. It can measure a company, employer or another entity. You have likely received an NPS survey yourself. It’s a score of 1 to 10 usually with a question of “How likely are you to recommend X to your friend or colleague?”
X could be your company, your customer support experience, an event, etc. If you answer 1 to 6 you are considered a detractor and at risk of customer churn, 7 & 8 are considered passives, and 9 & 10 are considered promoters. To get your score take % Promoters – %, Detractors. This creates a scale ranging from -100 to 100. 0 to 49 is considered good, 50 to 70 is Excellent and 70+ is World Class.
Additional resource: Why We Love Net Promoter Score (NPS)
Subscription Rate
This is the rate at which you are able to convert users into subscribers, usually paid but can also be a measure of email subscribers for instance. This can be measured to reflect different aspects of your business as well. For example, if you are a SaaS company, like ours, you may be measuring how many subscribers you have for your paid plan as well as how many people subscribe to your newsletter. The latter is also very important to us because it signals whether people find value and are interested in the content that we provide.
Program Participation Rate
The program participation rate refers to how many customers (or participants) you have enrolled in advocacy programs such as loyalty programs, referral reward systems, or take part in review platforms. The higher the number of participants reflects the greater value of the program.
Share Your eCommerce Growth with Contact Visible
Check out our E-commerce metric template- which all started a few years back when Dave Ambrose, Managing Partner at Steadfast Ventures, shared a template full of KPIs for eCommerce startups and founders. Since Dave’s original template, we’ve surveyed a few of our customers and friends to make some tweaks and add in new metrics
The setup of the template should be simple and ready to use and customize to your own liking out of the box. We’ve set the data to monthly but feel free to change to weekly, quarterly, etc. From here the template is broken down into 4 major metric categories — Customer Breakdown, Acquisition, Behavioral, and Operational.
Download the template here and also check out Our Guide to E-Commerce Metrics (with Google Sheet Template).
Additional Resources
- From the Visible blog with a video: Shopify Ecommerce Dashboard
- Sprout Social’s Social Media Metrics Map
- Hootsuite’s 19 Social Media Metrics That Really Matter—And How to Track Them
- Hubspot’s Free Download: Monthly Marketing Reporting Templates


