

A few years back Dave Ambrose, Managing Partner at Steadfast Ventures, shared a template full of KPIs for ecommerce startups and founders. Since Dave’s original template, we’ve surveyed a few of our customers and friends to make some tweaks and add in new metrics. Special thanks to Dave and the team at Italic for allowing us to share their key KPIs. Italic is an ecommerce company that sells “unbranded luxury goods straight from the source.” With $13M in venture funding and customers across the globe it is vital for Italic to keep a tab on their metrics across the funnel.
Related Resource: 10+ VCs Investing in E-commerce and Consumer Products
Using the E-commerce Metric Template
Related Resource: Key Metrics to Track and Measure In the eCommerce World
The setup of the template should be simple and ready to use and customize to your own liking out of the box. We’ve set the data to monthly but feel free to change to weekly, quarterly, etc. From here the template is broken down into 4 major metric categories — Customer Breakdown, Acquisition, Behavioral, and Operational.

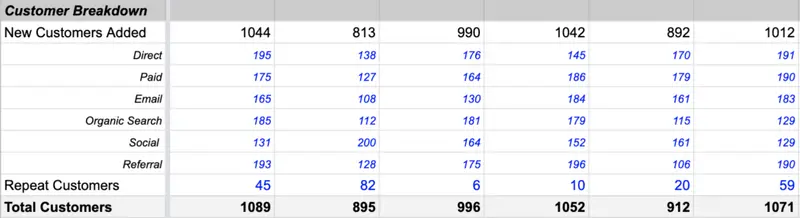
Customer Breakdown Metrics
This is a simple breakdown of where your new customers are coming from. For the template, we’ve included the following channels:These channels can vary from business to business to make any changes to the names/sources.
Acquisition Metrics
Acquisition metrics are particularly important when it comes to monitoring an ecommerce business. Our friends over at Italic like to break down their acquisition costs by paid and blended. This allows them to analyze how their paid channels are performing to the rest of the business. To learn more about customer acquisition costs, check out our guide here.
Jeremy Cai, CEO of Italic, explains LTV tracking and benchmarking:
“Typically it’s the amount of spend a customer has by a certain point (i.e. 6 month LTV, 12 month LTV, 2 yr LTV, etc) and people hope to see growth in this over time. For most higher ticket items, frequency will be close to 1 so they don’t expect LTV to grow very much but for subscription (toothpaste, razors) or higher replenishment items (consumables, beauty) then LTV growth is critical.”
Behavioral Metrics
These are the metrics that can help measure how customers are behaving and moving through the funnel once they have started the purchasing process. Put simply, Jeremy explains it as, “Basically it’s Add to Cart > Checkout Started > Checkout Completed, with a general 50% falloff between each step.”
Operational Metrics
These are the financial and operational metrics that make sure your business is healthy and running as expected. These metrics show how efficient your marketing and go-to-market efforts have been. Dave Ambrose keeps an eye on these metrics as an indicator to what ecommerce companies “are taking off.”
Connecting the E-commerce Metric Template with Visible
Naturally, the template connects to Visible in a few quick steps. Once you have the template added to your Google account head over to Visible. From here, you’ll want to make your way to the “Metrics” section and select “Add a new data source” –> “Google Sheet.”
After you’ve authenticated your Google account you’ll see the ecommerce template. Select the sheet and the correct tab from the sheet. As the sheet is setup with the date in row 1 and metrics in column A there is no need to make any further changes.
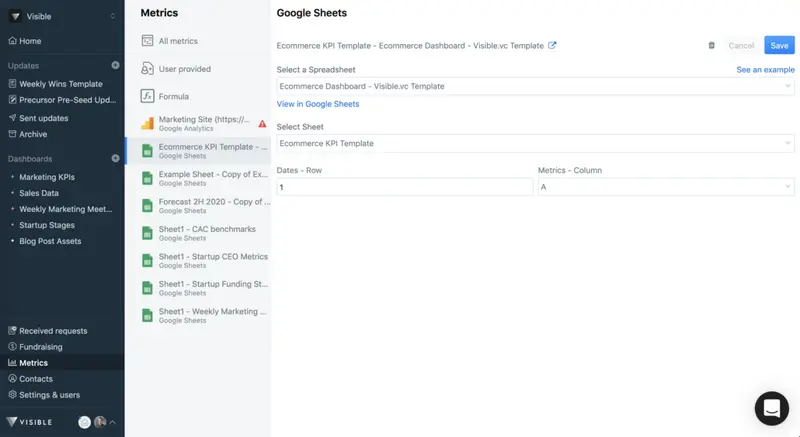
Click “save” and your new metrics will be brought into Visible. You can easily chart and share these metrics using Dashboards and Updates.
Raise capital, update investors and engage your team from a single platform. Try Visible free for 14 days.


