What is Your Ultimate Report? Part 1: Pacing

Ciaran Hanrahan
Part 1 of 4: Pacing
Unlock Your Investor Relationships With a Free Starter Account.
Get Visible Free

When we talk to our customers and potential customers we love to get an understanding of their “ultimate report”. It’s the report that stakeholders can quickly rally behind and understand how the business is performing, usually to a goal or target. Through this we’ve learned a ton and want to share the learnings with our audience through a 4 part series.

Part 1 of 4: Pacing

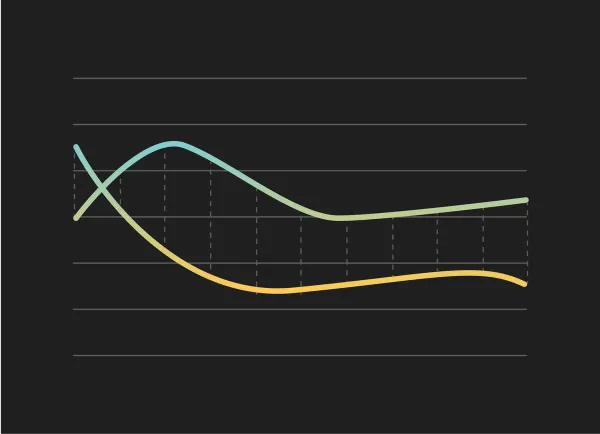
Today is Part 1 of the series, pacing. Pacing is a great way to apply weights to different periods throughout a range. E.g. You may close 40% of your deals in the last month of the quarter as reps have more urgency. Pacing should let you know if you are on track or not.The above chart is an example of pacing. This one in particular related to recurring revenue businesses by day but you can apply it to any business and timeframe. The goal is to be pacing 100% to your goal (the dotted line) throughout a period.

The inspiration for this came from David Skok’s SaaS 2.0 post, specifically from the Hubspot example.

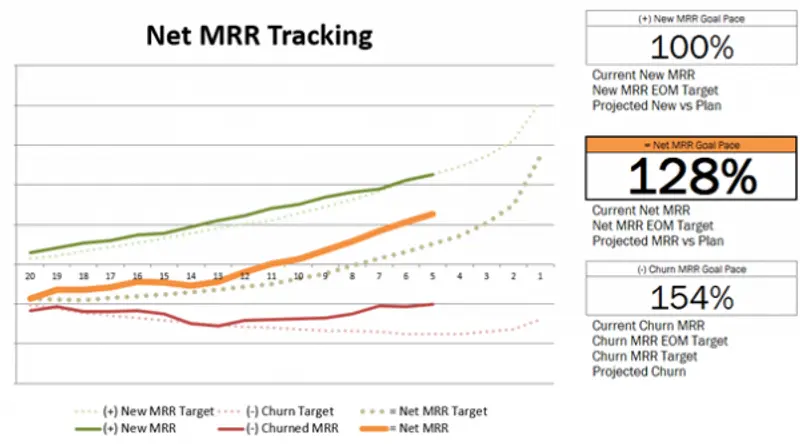
Through a period of time the Hubspot team wanted to know how they were pacing towards their monthly goal this way they could make any adjustments on the fly to hit their goal.

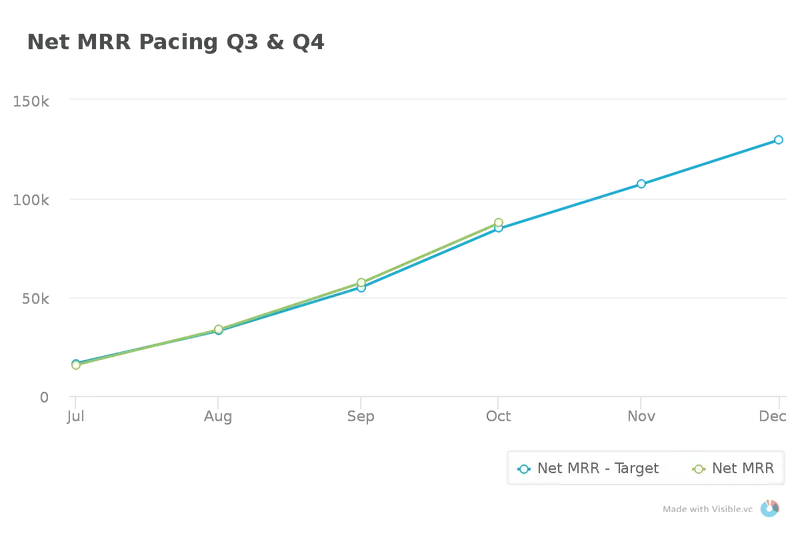
As you can see, the end of a period for SaaS sales may be weighted higher as there is more urgency for a rep to close a deal but you weights could vary depending on seasonality, buying cycles, business models, etc. Another view could be: This chart is showing we are pacing above where we should be relative to our Q4 target.

I love pacing because it helps make adjustments but gets the team aligned on where you should be. You might be only 2 weeks into a quarter but you want to know where you are compared to where you are supposed to end up. Being 10% to your Quarter target may be acceptable and makes sure the entire team and stakeholders are aligned while understanding the health of particular KPIs.

  • What is your ultimate report?
  • Want us to create it in Visible for you?
  • Want access to the Google Sheet template that powered this post? Drop us a note.

Up & to the right,

-The Visible Team

You may also enjoy:
Customer Stories
Turning Portfolio Data Into an Advantage: Inside Emergence Capital’s Workflow
When Andrew Crinnion joined Emergence Capital as Director of Portfolio Analysis, he stepped into a role that required more than crunching numbers. As a Series A investor in B2B SaaS companies, Emergence prides itself on being data-driven, but that only works when the correct data is accessible, consistent, and actionable. The challenge? Their portfolio was growing fast, but performance tracking lived in scattered spreadsheets and inboxes. "Before Visible, it was Excel Sheets and lots of manual emails," Andrew explained. "We were a pretty data-driven firm, which gave me a good foundation. But we needed a better way to scale." A Central Source of Truth Andrew was tasked with finding a portfolio monitoring solution that could grow with their fund and simplify performance data management. After evaluating platforms like iLevel, Dynamo, and Standard Metrics, he ultimately chose Visible. What stood out? "Flexibility," he said. "The ability to build dashboards and calculate our own metrics was huge. Before, I'd ask for something like burn rate and NDR, and I wasn’t always sure how it was being calculated. So being able to calculate it within the system was a big help." The transition was smooth. After merging their existing data into a more structured format, onboarding to Visible was seamless. “It was real smooth to load that into Visible and move forward.” Driving Better Decisions With Visible in place, Andrew can surface insights faster and share them more effectively with the general partners. "Once a company responds to our Visible Request, it graphs it out. I can see if burn rate increases or if runway is dropping off, and it prompts me to ask the right questions to the GPs. It keeps us aligned." The dashboards are a core part of portfolio reviews and one-off requests alike. "They don’t really see how it’s getting made,” he said, “but it makes it a lot easier for me to answer their questions.” Better Data = Stronger LP Relationships When communicating with LPs, the value of Visible became even more clear. When LPs are digging into performance, portfolio metrics, and fund-level questions, the Emergence team is ready. "Visible helps me quickly respond to all our LP requests. I have a repository of data that makes it easy to pull what they need. It also helps GPs answer LP questions faster, with more confidence." By having a centralized system to rely on, Emergence offers transparency and builds trust with its limited partners, a key ingredient in any relationship. Turning Internal Value Into External Impact As Emergence’s data infrastructure matured, Andrew saw an opportunity to scale the value of what they were learning. Portfolio companies were coming to him with questions like, “What should my CAC payback be?” and “How much should I be spending on R&D?” Thanks to the insights they’d built internally with Visible, Emergence launched the Beyond Benchmark report, an external study based on data from over 560 companies. What began as a tool for internal alignment became a valuable resource for the broader SaaS community. Support That Scales With You Throughout the process, Visible’s Customer Success team remained a key part of the experience. “They’ve been great. I’ve shared product feedback, and it’s been implemented. They’re responsive and invested in helping us succeed.” Emergence Capital didn’t just choose Visible, they built a system around it. For funds building out platform or investor relations teams, he recommends investing early in the right metrics and infrastructure. The payoff? Faster answers, stronger LP conversations, and the confidence to scale with clarity. Check out how you can join Emergence Capital and leverage Visible for your portfolio monitoring and reporting here.
Fundraising
Lead With Your Strengths with Jonah Midanik
Operations
Storyselling with Kristian Andersen of High Alpha
Metrics and data
Using Benchmarks as a Diagnostic with Kyle Poyar