Blog
Visible Blog
Resources to support ambitious founders and the investors who back them.
All
Fundraising Metrics and data Product Updates Operations Hiring & Talent Reporting Customer Stories

founders
Product Updates
Product Update: Filtering & Bulk Editing
We recently pushed some great improvements to the Data section on Visible to make it easy to search, filter and edit your respective metrics. We also make some speed improvements so the data section should load faster as well!
Filtering & Sorting
You can now sort and filter by categories & data sources. Simply click the filter icon and select your respective fields to filter the data table.
Bulk Editing
Select multiple metrics and quickly edit many metrics at once. You can quickly assign a new category and metric type with the new bulk editor as well as delete metrics you no longer need.
Be on the look out for even more improvements in the future. We hope you enjoy!

founders
Metrics and data
Ultimate Report Part 3 of 4: ARR Movements
Welcome to part 3 of 4 of our Ultimate Report series. When we talk to our customers and potential customers we love to get an understanding of their “ultimate report”. It’s the report that stakeholders can quickly rally behind and understand how the business is performing, usually to a goal or target.
Part 1: Pacing
Part 2: Cadence & Operational Metrics
Part 3: ARR Movements
Part 4: Coming on July 12th
This week, our ultimate report is ARR Metrics. For any SaaS business, the movements in your recurring revenue are crucial to making decisions, hiring and resource allocation. What makes SaaS metrics great are that they are fairly easy to benchmark across industries.
Tracking Your ARR Movements
This report focuses on 4 key recurring revenue movements.
New Business ARR: When a lead converts to a customer (for the first time)
Expansion ARR: When an existing customers increases their recurring spend with you (more seats, better package, etc)
Contraction ARR: When an existing customers decreases their recurring spend with you (less seats, downgrade plan, etc)
Churn ARR: When a customer cancels their subscription and doesn’t renew.
If you want to dig into more SaaS metrics and definitions we recommend checking out our friends at ChartMogul and their SaaS Metrics Cheat Sheet. P.s. we have an awesome integration with them!
founders
Metrics and data
Ultimate Report Part 2: Cadence & Operational Metrics
Your Ultimate Report: Sharing Operational Metrics
Welcome to part 2 of 4 of our Ultimate Report series. When we talk to our customers and potential customers we love to get an understanding of their “ultimate report”. It’s the report that stakeholders can quickly rally behind and understand how the business is performing, usually to a goal or target.
Part 1: Pacing
Part 2: Cadence & Operational Metrics
This week we want to touch on two key parts of the reporting process every company should be doing.
Operational Metrics
Developing a cadence for stakeholder reporting
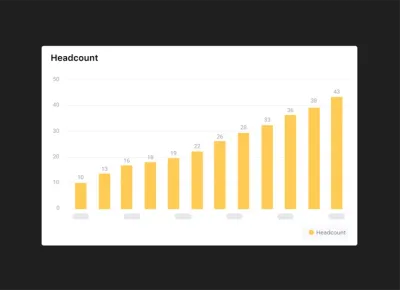
The below chart is a common one that most VCs love & one that you’ll see in just about every “Investor Update” template post online.
The goal here is to quickly see:
How fast is your top line growing?
How much cash is in the bank?
Is burn under control?
What does headcount look like?
With Visible, this is incredibly easy to visualize and automate through our different data integrations. Putting this together should take no more than a couple minutes.
The other key to great reporting is not doing it just once but building a repeatable cadence that is timely.
According to Peter Drucker, the key to building a successful company is about how well you attract and retain both talent and capital. Attracting capital (read: investors) is one thing; but how do you handle the added pressure of putting someone else’s capital to work? Regular communication.
While we spend most of our day talking with founders and operators we also spend a good amount of time speaking with stakeholders and those “consuming” reports. The one component they look for more than certain metrics, wins, losses, or other sections? Regular communication. With some back of the envelope math we have found companies that regularly communicate with their investors are twice as likely to raise follow on funding.
Consistent communication builds trust and helps keep you top of mind for your investors. It also creates accountability on both sides of the table. When an investor comes across a great designer looking to join a startup, who do you think she will recommend? The company she hasn’t heard from since wiring the money, or the one that comes to her each month with a quick overview on how things are going and how she can help?
But what is “regular communication”? That is something that should be answered by your, your team, and your stakeholders. Find a cadence that works best for both you and your stakeholders. One of our favorite cadences we see companies use is similar to the one below:
Weekly – Short, data heavy Updates sent to the entire team. Highlight big wins, losses, and your “North Stars” for individual departments
Monthly – A more qualitative focused Update sent to all Investors and stakeholders highlighting all important wins, losses, and questions from the month.
Quarterly – the “friends and family” Update. Send to any of your stakeholders that have interest in the business with a quick update on the state of the business while keeping potential investors in the loop.
Make sure to check our recurring templates in Visible to help automate your cadence.

founders
Product Updates
Xero Tracking Categories
Introducing Xero Tracking Categories
We recently launched additional improvements to our Xero integration that all of our customers can start taking advantage of today.
In addition to getting financial metrics and chart of accounts metrics from Xero, you can now filter any of your metrics your respective Xero tracking categories.
It’s as simple as selecting a metric and then clicking the drop down to apply the tracking category. You can add as many of the same metrics as you’d like. E.g. if you wanted Revenue across all of your sales regions you can bring those in!
Protip: Transform your Xero Tracking Categories with our formula builder.
You can read more about the Xero tracking categories in this knowledge base article. Questions? Send us an email.
Up & to the right,
-The Visible Team

founders
Reporting
What is Your Ultimate Report? Part 1: Pacing
When we talk to our customers and potential customers we love to get an understanding of their “ultimate report”. It’s the report that stakeholders can quickly rally behind and understand how the business is performing, usually to a goal or target. Through this we’ve learned a ton and want to share the learnings with our audience through a 4 part series.
Part 1 of 4: Pacing
Today is Part 1 of the series, pacing. Pacing is a great way to apply weights to different periods throughout a range. E.g. You may close 40% of your deals in the last month of the quarter as reps have more urgency. Pacing should let you know if you are on track or not.The above chart is an example of pacing. This one in particular related to recurring revenue businesses by day but you can apply it to any business and timeframe. The goal is to be pacing 100% to your goal (the dotted line) throughout a period.
The inspiration for this came from David Skok’s SaaS 2.0 post, specifically from the Hubspot example.
Through a period of time the Hubspot team wanted to know how they were pacing towards their monthly goal this way they could make any adjustments on the fly to hit their goal.
As you can see, the end of a period for SaaS sales may be weighted higher as there is more urgency for a rep to close a deal but you weights could vary depending on seasonality, buying cycles, business models, etc. Another view could be: This chart is showing we are pacing above where we should be relative to our Q4 target.
I love pacing because it helps make adjustments but gets the team aligned on where you should be. You might be only 2 weeks into a quarter but you want to know where you are compared to where you are supposed to end up. Being 10% to your Quarter target may be acceptable and makes sure the entire team and stakeholders are aligned while understanding the health of particular KPIs.
What is your ultimate report?
Want us to create it in Visible for you?
Want access to the Google Sheet template that powered this post? Drop us a note.
Up & to the right,
-The Visible Team

founders
Metrics and data
Product Updates
Video: Formula Builder (Customer Acquisition Cost)
How to Calculate Customer Acquisition Cost in Visible
Check out the video above to get a glimpse of our formula builder. In this example we calculate customer acquisition cost by combining data from Salesforce and Google Sheets!

founders
Metrics and data
Why We Love Net Promoter Score (NPS)
We’re huge fans of the NPS (Net Promoter Score) at Visible. This article is all about NPS & is broken down into 4 sections.
What NPS is?
Why we love it!
How we implement it.
Do unanswered NPS surveys correlate to churn? (This question was the original idea for writing this post)
What is NPS?
If you’re not familiar with NPS, it is used to gauge the loyalty of a firm’s relationships. It is used by more than 2/3 of the Fortune 1000 and it can measure a company, employer or another entity. You have likely received an NPS survey yourself. It’s a score of 1 to 10 usually with a question of “How likely are you to recommend X to your friend or colleague?”
X could be your company, your customer support experience, an event, etc. If you answer 1 to 6 you are considered a detractor and at risk of customer churn, 7 & 8 are considered passives and 9 & 10 are considered promoters. To get your score take % Promoters – % Detractors. This creates a scale ranging from -100 to 100. 0 to 49 is considered good, 50 to 70 is Excellent and 70+ is World Class.
To give you an idea for the 4 Major Airline Carriers in the US the scores are as follows:
American: 3
Delta: 36
Southwest: 62
United: 10
On the other hand of the spectrum Apple clocks in at 89. (*note these are rough estimates from free online resources).
At Visible our NPS is a 75 and we are incredibly proud of that!
Why We Love NPS
We love NPS for a number of reasons but all of them are related to being a signal that is reported directly from our customers. We have written about NPS before in “How to measure customer experience better”.
With NPS we can identify problems we didn’t know about. Here is a real example… it looked like we have an incredibly active customer that loves our product but they recently answered our NPS survey with a 2 stating our pricing didn’t make sense for our business. This allowed us an opportunity to start a conversation on how we could better price our product for a particular customer prior to them churning.
A strong NPS is a great sales tool as well. It is something we can speak to with our customers, investors, potential hires, etc. Not only can we point to company logos as customers but we can prove that they love using the product. It’s also great for motivating the team internally as it touches all parts of the business.
NPS qualitative feedback is also amazing. The score is great but understanding why they scored the way they did is gold. At Visible we hear two things over and over again. 1) It’s simple and 2) great customer support. We always think about these two main pieces of feedback as we build the product and talk to our customers. We want to make sure we don’t overcomplicate the product and continue to serve the customer the best we can.
Finally, NPS is a great signal for early stage companies to use as an early identified or product-market fit before they have metrics at scale.
How Visible Implements NPS
We use NPS for all of our customer relationships. We’ve tried using NPS for free trial users or if customers used a particular feature but found that data didn’t yield any insightful data. We care most about the customers who providing us with their credit card in exchange for our service.
We use Promoter.io to handle the surveying, scoring and all things related to our NPS. There are a bunch of providers in the market but found that Promoter works best for our needs. Once a new customer signs up on Visible we then tag them as customer in Intercom. This then adds that customer to a queue in Promoter where we set a 20 day delay before the first survey is sent.
Why 20? We don’t want to survey right away as we want them to get all the benefits of the product, have a customer success interaction and fully dive into our offering. With a 20 day delay we also give ourselves 10 days to address any problematic issues with a customer that may be paying us monthly to avoid churn. From there the customer gets surveyed automatically 60, 90 and 180 days after the most recent survey. Each survey has an auto-reminder 3 days after an initial send if they haven’t responded.
Do unanswered NPS surveys correlate to churn?
There is a solid argument to make that detractor NPS scores (0 to 6) correlate to revenue churn; however, what about customers that don’t respond to NPS surveys? My hypothesis was that if customers don’t care enough to answer a simple survey that just takes one click to answer, do they really care about the solution?
Of our customers that churned in the past 6 months, 43% of them responded to the NPS survey. That response rate falls in line with our active customer base. Of those that answered, all of them were promoters (answered with 9 or 10)! This was actually quite perplexing and something I don’t have a great answer to (yet). If you do, we’d love to hear from you! I wish I had an amazing, ground-breaking takeaway for this last point but the reality is we are still in first inning of our NPS journey. As we get more data, more experience and learnings we’ll make sure to update it!
Questions, thoughts, comments? Email hi at visible dot vc. Want to share your NPS with your team and stakeholders? Sign up for Visible!
Up & to the right,
-The Visible Team

founders
Product Updates
Consolidated Xero Reporting
Automatically Consolidate Multiple Xero Accounts
If you run a business that operates in different countries, different currencies or one that requires many Xero or Quickbooks accounts, you will know the pain of consolidated reporting.
Being able to quickly get an understanding of Revenue, Cash Position, Expenses and more can be a pain. Luckily, with Visible and our formula builder, you can now quickly and intuitively combine many accounts for your consolidated Xero reporting.
Customers can connect as many Xero or Quickbooks accounts as needed. From there, it’s as simple as creating a new metric from a formula and building your new consolidated metric.
If you want to convert the currency of a particular metric, you can apply the logic of Exchange Rate * Metric.
You can read more about our formula builder and data transformation in our most recent announcement. If you are an accounting or finance professional, we’d love to talk to you! Feel free to contact us at spectrum at visible dot vc and make sure to check out our partner program.

founders
Product Updates
A + B = C -> Introducing Formulas on Visible
We’re excited to give you a sneak peek & preview our new Formula builder. With our intuitive Formula builder you’ll be able to create functions by using any of your current metrics, from any data source, integration or providing a metrics directly.
This will be a game changer as you’ll be able to dynamically create new metrics and transform your existing data streams directly on Visible.
The Visible Formula Builder
In the example above, we take calculate Customer Acquisition cost by taking Sales & Marketing Expenses from Xero and dividing by New Customers coming from Salesforce. Just one of infinite possibilities!
As new data comes into Visible your formulas will update on the fly and the new data points will be readily available at your fingertips.
If you wish to get on the beta shoot us a note at beta@visible.vc. You can read more about the integration in our knowledge base and we put together this quick explainer video as well.
Up & to the right,
-The Visible Team
founders
Product Updates
April Product Improvements – Data Labels, Annotations, Goals & more
Hey there – We wanted to provide a quick recap of all of the major functionality that we’ve launched in April. As always feel free to send us any feedback, questions or comments.
Data Labels on Charts
You can now add the actual value on the data point on your charts. This will display the actual values of the respective metric on the chart itself.
We suggest using charts with 8 or less data points to utilize data labels or you’ll quickly overcrowd the visualization.
Chart Annotations
While you are creating or updating a chart you can now call out specific data points and add your own context through annotations. Simply click on any data point and add in text.
Goals
With any chart you can now add a goal, benchmark line or threshold targets. Simply navigate to the Options tab to customize your different goals and benchmarks.
File Attachments in Updates
Visible Updates now support file attachments. They’ll be available as one-click downloads and we’ll automatically detect the file type and add a nice icon for you! They are great for more granular financial statements, presentations or supplemental data sets.
Table support in our text editor
Our Updates text editor now supports tables. They are great for structuring any of your qualitative information in Updates.
Other minor yet useful improvements:
Better support for copying and pasting text from other text editors into Visible Updates!
A very beautiful looking success message once you publish an Update in Visible.
-The Visible Team

founders
Hiring & Talent
Why Sales Enablement Matters
If sales enablement helps maximize your company’s efficiency and effectiveness, ignoring the importance of this training is essentially disregarding the need for real growth. But sales enablement isn’t as sexy as product improvements. There aren’t demo days to showcase a new hire training course. There are real metrics to track, but the relatively new discipline can still be a little vague.
And in age where some argue that your software should be so good it sells itself, why not invest in new features rather than sales enablement? Why not bypass optimizing outbound efforts and implement irresistible new features instead?
Because your organization will always be in the business of convincing customers why they need your solution, not just what it offers if you wish to scale effectively. “Even though the enterprise sales process has many steps and stages, it ultimately has to answer three questions for the customer: why buy, why you, why now,” Mark Cranney writes.
To answer these key sales questions, you need to go beyond just hiring talented reps and effective managers. You need enablement pros to analyze, educate and build plans to avoid some of the sales’ biggest hurdles. But unlike a new account executive, a sales enablement hire won’t bring in 4x their salary in new contracts. Instead, over time they will empower the entire organization to hit goals and achieve larger multiples, but only with executive buy-in and a focus on the long-term. Here are some of the best ways your sales team and your enablement crew will work together to make this happen.
You need to customize a unique value proposition
Especially in the early days, the way you sell your software will often change quicker than the product itself. Understanding the needs and initiatives of each individual client and determining how your own capabilities and unique features solve their pain is crucial.
You’re not going to recognize these factors simply with a freemium software offering that requires the client to go through the journey alone. And your sales team won’t be able to knock this part of the process out of the park without proper support and training. Sales enablement teams can help develop questionnaires and strategies for shaping a client’s unique value proposition. Your enablement team will also train your reps on the best way to demonstrate this value. As a result, you’re likely to experience a jump in close rate and greater success against competitors.
Navigating an internal sales process
Your sales team faces one of its biggest obstacles when it comes to actually getting the client to sign on the dotted line. A rep may come to terms quickly with a prospect, but getting your contact to return a signed document can be another ordeal entirely. Even if the person on the other end of the line is the decision maker, receiving proper authorization, filling out the right paperwork or allocating the necessary budget can really slow your sales cycle down.
One of the main reasons you have an outbound sales team is to quickly learn the barriers these clients face internally and adapt to help assist them in the effort. One of the main reasons you have a sales enablement team is to identify the common problems that your prospects face and design better strategies to navigate a faster course to closing deals.
No one else will focus on improving the entire organization
Reps close deals. They have quotas to meet and little time to reflect on process improvements when they’ve turned their focus to individual opportunities. Even if your most senior sales members possess a wealth of knowledge, you won’t be able to disseminate their expertise without the right people in place to turn these insights into valuable courses.
And it’ll be your job to champion these efforts and avoid the temptation to leave sales to learn without support or invest an unnecessary amount into product early on.

founders
Product Updates
Announcing Our ChartMogul Partnership & Integration
Visible + ChartMogul
We’re excited to announce our partnership today with ChartMogul. ChartMogul provides analytics for building a better subscription business to over 800 customers (and growing!). By integrating with Stripe, Braintree, Recurly and more, ChartMogul provides turnkey metrics to give you instant insight into your customers.
Visible customers will be able to integrate their ChartMogul metrics directly into Visible and use for their own stakeholder reporting.
Our initial integration includes your recurring revenue metrics, customer metrics, churn data and LTVs. We’ll continue to improve the integration so send any feedback our way. You can find more info on the ChartMogul + Visible feature page.
If you have any questions or comments about Visible + ChartMogul send them to hi@visible.vc. Current Visible users can read more about the integration in this knowledge base article.
Up & to the right,
-Mike & The Visible Team

founders
Product Updates
Winter Wrap Up
With spring around the corner we wanted to provide the latest in the Visible world. Below we’ll highlight some key functionality that has been released over the past couple of months.
Data Source Integrations
We made some great improvements to our existing integrations, added new data sources and currently support 10 direct data sources in Visible.
New integrations include Mixpanel, Advanced Google Analytics and ChartMogul.
Update Improvements
Updates can now be sent through a shareable and trackable link in addition to email. We also added support to save Updates as PDFs and improve the editor experience.
View Example Update
As always, please feel free to directly respond with any questions, comments or to setup a time to chat!
Up & to the right,
The Visible Team

founders
Hiring & Talent
How is the Role of Sales Enablement Changing?
Within a matter of years, sales enablement has rapidly changed from simply a topic of conversation to a vital part of any growing organization. Now, new leadership roles are being created in companies to drive sales enablement performance. The conversation around the future of SaaS even seems to be driven by the work of these nascent teams of trainers.
What’s changed? While still a somewhat ambiguous term defined in different ways by individual organizations, the focus of sales enablement teams to better identify underlying product, sales and marketing obstacles and introduce more effective solution is an unavoidable function of growth in any B2B environment.
A focus on effectiveness
To earn that level of effectiveness, it will require attracting talent in a relatively new area of expertise. As Brian Lambert of the Sales Enablement Society wrote, the role of sales enablement will not be limited to recommending technology solutions to improve process. Instead, it will be essential that enablement teams are competent enough to collaborate with leaders across all departments “to improve revenue consistency through proactive and structured initiatives and coordinated efforts,” Lambert said. “The type of work that our members engage in goes beyond deploying a technology tool or platform.”
Finding a differentiating strategy
In his recent review of SaaStr, Chris Orlob noted that one of the key conference takeaways was that the function of sales enablement teams in the near future will to be focus not on differentiating features in the software, but instead better defining the “how we sell” question to create better sales strategies. “With so many SaaS sales tools focused on sales efficiency, sales effectiveness is now becoming the name of the game in the ‘sales acceleration’ category of software” Orlob wrote.
Adapting to rapidly changing technology
This outlook on sales enablement pairs well in an environment with dramatic technology growth in B2B sales. The role of sales will likely be greatly aided by a rise in tools like artificial intelligence, infinite computing, networks and sensors and robotics. As more customer behavior is tracked, processed, recorded and reviewed, it’ll be the role of the enablement teams to mold these insights into actions that drive sales growth. Key enablement metrics like reducing sales cycles and decreasing time to quota and pipeline obtainment for new reps should drop considerably if teams have better technology to get the job done.
Scaling sales enablement internally
Katie MacDonald, global sales onboarding and enablement manager at Optimizely, recently told me that the new approach to sales enablement will be to motivate employees outside the team to get involved in the training process. “As sales enablement scales, we need to be enabling managers, too.” MacDonald said. “What do we need to train managers on to enable the enablement team’s efforts? What do we need to do to make sure these training recommendations are being followed after the training ends?”
Providing greater distribution of the day-to-day responsibilities of training frees the enablement team up to focus more on strategy, metrics and the best way to utilize new technology across the organization.
Because of the greater focus on enablement, look for organizations to focus even more effort on recruiting, hiring and obtaining sales enablement talent as these roles will take on more prestigious titles with greater responsibility. There’s little question that the idea of enablement will continue to change as quickly as the companies that need it, but it’s almost impossible to see a future that reverts back to a time when enablement seemed like a luxury.

founders
Metrics and data
3 Metrics to Track to Start Sales Enablement
The success—or lack thereof—of a sales enablement team isn’t the easiest to track because the area itself isn’t always clearly defined. When a scaling company develops its initial sales enablement strategy, it’s often a struggle to determine exactly what the organization needs to focus on first. And that lack of clarity can present a real problem. “Enablement means something different in every company,” Katie MacDonald, global sales onboarding and enablement manager at Optimizely, said. “A lot of companies think they need enablement. But if there is not a clear understanding of the purpose of sales enablement, it can die very quickly.”
So how do you start? Simply. Focus first on a handful of easy-to-identify valuable functions that drive performance in a sales organization. Here are three great ways to start:
Decrease time to quota obtainment
All new hires face a steep learning curve when entering a new organization and a new sales process. Providing the right tools that boost a new hire into peak productivity mode is remarkably important. And cutting down the number of days until that happens can wildly profitable. So the role of a new sales enablement team must start hacking at that time to quota obtainment with insights for into the sales process. Empowering new hires with basic strategies that overcome common obstacles that have slowed success in the past is a key component in enabling the sales team. Identifying selling pitfalls, core value propositions and common pain points and some additional tricks of the trade helps shorten the road to top performance.
Decrease time to pipeline obtainment
In order to hit that quota, reps need to fill the pipeline first. Most companies will use the 3x sales pipeline-to-quota-ratio as the goal for the sales team. For the sales enablement team, it’s essential to identify the best ways new reps can hunt for new leads. Your enablement team can provide information on the right customer types, how to best reach them and how to determine which opportunities might be better than others.
Again, you’re providing new reps with a better roadmap to avoid obstacles others have already encountered. The bottom line is if your sales enablement team isn’t decreasing time to quota obtainment or pipeline obtainment, they aren’t providing the right boost to your onboarding efforts.
Decrease sales cycles
Finally, moving beyond new hires, sales enablement teams must deconstruct the sales cycle and find ways for the entire organization to cut down on the time to commitment. They have to monitor how deals track through the process and identify common factors that are often introduced and slow down the action. Sales enablement teams gather intelligence and data from across the team and synthesize the learnings into communication training that drives iterative improvement. That speeds up the process and makes enablement worthwhile in the long-run.
There is almost no end to the avenues your enablement team may explore to keep your organization innovating and working smarter. But by focusing first on just a few key areas, you can convince investors of the need for sales enablement and earn buy-in from the rest of your leadership team of its value.
Unlock Your Investor Relationships. Try Visible for Free for 14 Days.
Start Your Free Trial