
Why Send Investor Updates
Investor updates can help in a number of ways. We’ve laid out some of the top reasons for sending investor Updates below. To learn more about why you should send investor updates, head here or visit the Visible Blog.
Communication saves companies
If your investors don’t know what’s going on in your business, they don’t know how to help. Investors provide more than capital. They offer advice, expertise, introductions, and more.
Accountability and trust
Proactive communication builds trust. When investors are kept in the loop they are more likely to help. You’ll always be top of mind for introductions, customer referrals and potential hires.
Follow-on funding
Follow on funding is imperative for success. Current investors provide signal, can lead rounds or can step in to bridge a financing. Make sure your current investors are allocating future capital by demonstrating your commitment to transparent communication and good governance.
Below are the steps for getting successfully set up on Visible to send your first Investor Update. Have a question or need a hand with anything? You can reach out by using the Intercom chat messenger located in the bottom right of you screen.

Starting with Metrics
Sharing metrics allows investors to understand how your business is performing. If a certain metric or KPI is down, don’t be afraid to share this — it happens. In fact, investors can likely offer help to turn things around.

In general, we suggest keeping the metrics you share consistent. You know your business best, so what financials and KPIs to share will vary. If you’re looking for more on what metrics to share check out the Founders Forward Blog here.
To get started with metrics and charts in Visible, click the “Metrics” tab towards the bottom of the left hand side navigation. If you do not use any of our data sources, we suggest getting started with a Google Sheet or User Provided metrics.
For this example, we’ll walk you through getting a Google Sheet connected. The video below will walk you through connecting Google Sheets.
We are using this Google Sheet in our example. Feel free to make a copy (using this link) to follow along at home! We suggest keeping the date + metric format and swapping out metric names where you would like.
You can find a more involved article for getting started with Google Sheets here and articles for connecting other integrations here.
Charting Your Data
Once you have your metrics and data in Visible, it is time to start creating charts. We suggest creating charts in a dashboard to start. You’ll be able to select any of your dashboard charts when you craft your Updates.
From a dashboard, click “+” button followed by “Chart” as shown below:
Screen Recording 2020-03-17 at 02.01 PM.mov
Once you’ve opened the chart builder. Select what metrics you’d like to pull into the chart. You can select as many metrics as you’d like from any data source! For this example, we’ll be creating a chart with Revenue and Total Expenses.
Screen Recording 2020-03-17 at 02.11 PM.mov
A couple of tools/tips when using the chart builder:
Enhance Individual Metrics — If you click on a metric from the chart builder, you’ll be able to enhance your metrics with our business intelligence layer, chart colors, aggregation, and chart the metric on the Y-axis.
Options Tab — From the options tab of the chart editor, you can edit the visualization and settings of the chart. From the top half you can change the chart title and chart type. Moving down you can pick the metric name or date to show on the x-axis, show data labels, show data markers for line charts, and set a y-axis scale.
In the bottom half of the options tab, you can change the display frequency, pick a time period to display the data, and add in goal lines.
Add Annotations — To add text annotations directly to a chart, click on any data point and select “Add Annotation” when you have the chart builder open. You can add up to 100 characters.
Creating Your First Update & Using the Editor
Now that you’ve got a hang for creating charts, it is time to create your first Update! To get started, click the “+” sign next to Updates in the left hand side navigation. You will have the option to use a blank Update or start with one of our Update Templates.
Screen Recording 2020-03-17 at 02.14 PM.mov
For this example, we’ll walk through our basic investor update template.
This a rough guideline of what we have found to be best practices for sharing investor Updates. Feel free to make any changes to the Update Template that you would like.
With Updates you can include and combine any of the following components:
- Text with rich formatting
- Images
- Charts
- Side-by-side charts
- Tables
- Files
- Line breaks
Check out the video below for a quick breakdown of our Update Editor:
Rich text — Simply highlight text to expose our editor. Create bulleted and numbered lists, create merge tags, and hyperlink text from here as well.
Build and include charts — Connect data and build charts. To include a chart in an Update, hit enter on your keyboard and you will see an option to add a component to the right side. Select an existing chart or build a new one directly in an Update. You can include as many charts as you’d like as well as tables and side-by-side charts.
Files and Images — To include a file or image, click enter and you will see an option to add a component to the right side (same as a chart). Select the image or file icon to embed either directly in your Updates.
Sharing Your Qualitative Data
You’ll notice in our standard investor Update template it is broken into a few key qualitative sections:
Highlights — Always start with the good news! Briefly recap your company highlights, including things like goals hit or exceeded, new key hires, product updates, etc. Anything that made the previous month great.
Lowlights — Next, include some areas where you struggled or could use some help. Noting the steps you’re taking in response is even better, as investors will see you reacting to tough situations and moving forward. Transparency is key!
Asks — Potentially the most important part of your update! Here is where you can leverage your investors and get the help you need. Make specific asks that investors can easily respond to by drawing on their networks, experience and advice.
Thanks — Giving credit where credit is due is important. This is where you can call out team members who went above and beyond in the previous month. Also, specifically call out any investor who responded to your previous month’s asks, or helped you in another way. Nothing wrong with creating a little peer pressure for your other investors!
Customer Story — Investors love to see customer reactions to your product or company. Include customer feedback, social media mentions or anything that highlights how you’re impacting your buyers.
Monthly Metrics — Finally, include the key data your investors want to see. This will vary from company to company, but we recommend all companies track Revenue, Burn, Cash in Bank. Include everything you think investors will want to see, but don’t go overboard with unimportant numbers. If you aren’t sure what charts/metrics to include, just ask!
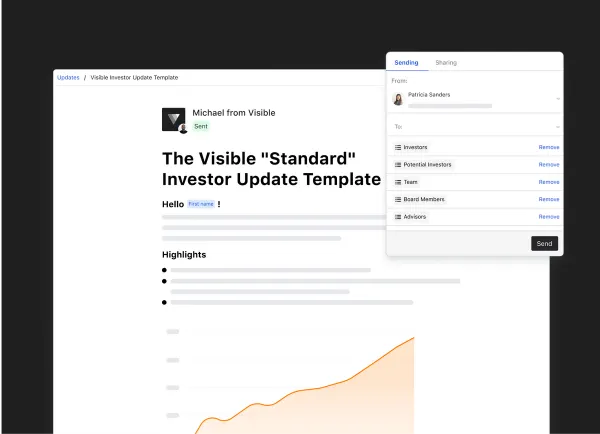
Sending Your Update
Once you’ve got your charts and qualitative sections dialed in it is time to share your Update with your investors.
There are 3 main ways to share an Update; email, link, and Slack. To get started with all 3, click the “Send” button in the top right corner. From here, you’ll be able to share via email in the “Sending” tab and/or setup a link/Slack share in the “Sharing” tab.
Screen Recording 2020-03-17 at 02.26 PM.mov
A couple of things to note when sending Updates:
Create Contact Lists — By clicking “Contacts” in the left side navigation, you’ll be able to create segmented lists. For example, you could create a list of “Investors” that has all of your investors. Instead of adding individual contacts, you can add a list. Learn more here.
Stats — After you send an Update, we’ll display engagement stats. View clicks, opens, and “reactions” to your Updates. Learn more here.
Reactions — Reactions are a simple thumbs up icon at the bottom of your Update that investors can click to acknowledge they’ve read your Update. Think something similar to a like on Facebook or Twitter. Lear more here.
We hope this guide was helpful! If you have any questions or need a hand with anything don’t hesitate to reach out via email or by sending a message using the Intercom chat in the bottom right corner.
If you’re ready to take your reporting to the next level be sure to check out our Founders Forward Blog and Update Template Library.


