Understanding the performance and impact of your portfolio is critical for decision-making, follow-on investments, and raising future funds.
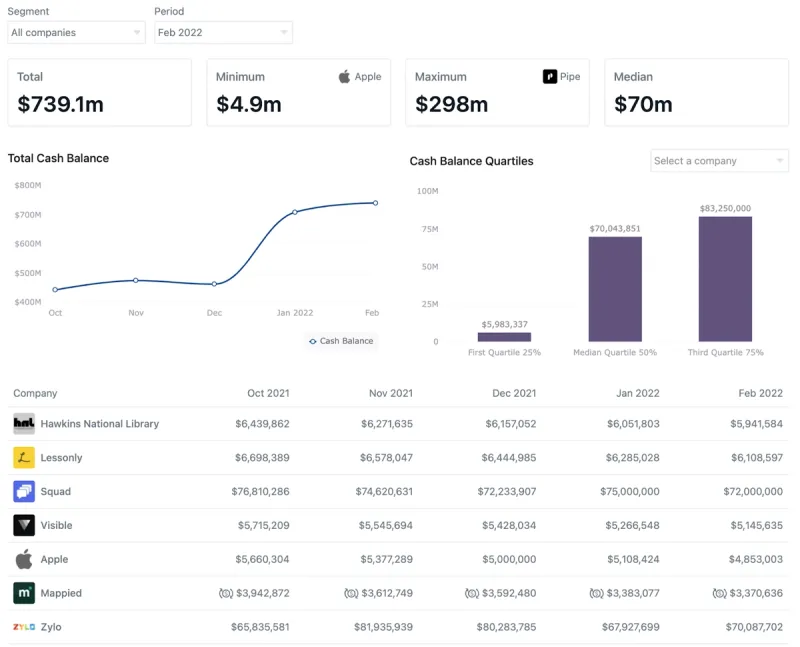
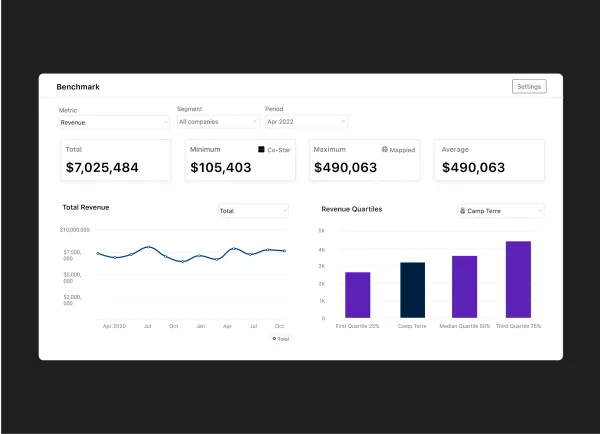
Available today, portfolio metric dashboards will give investors instant insights into portfolio company operational performance.

Visible will automatically provide investors the following:
- Total – The total sum for a given metric included a time series trend chart
- Minimum – The minimum value and respective company
- Maximum – The maximum value and respective company
- First Quartile 25%
- Median Quartile 50%
- Third Quartile 75%
Investors will also be able to view benchmark data for any current portfolio segments or for a particular period.
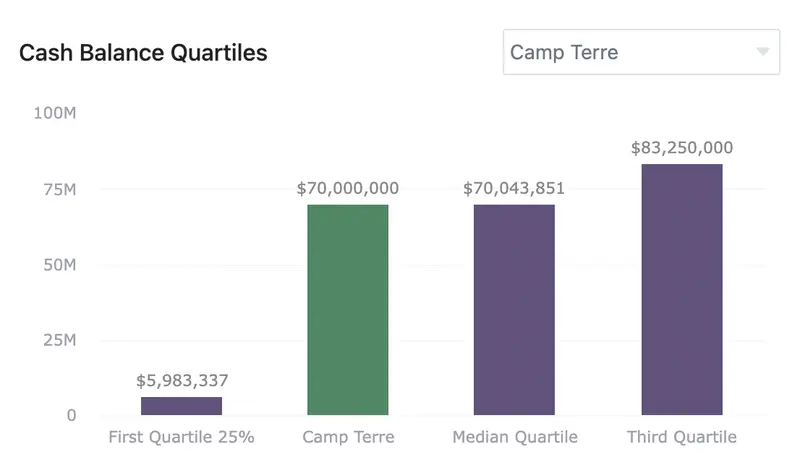
Quartiles
Investors can also select any portfolio company to quickly view their performance relative to the respective portfolios.

As always let us know if you have any questions or feedback!
Up & to the right,
Mike


