Integrations
Mixpanel + Visible
Your event data brought directly into Visible



Overview
Chart your product analytics alongside vital company KPIs with our Mixpanel integration. Connect your Mixpanel account, select your metrics, and create charts that update automatically. Learn more about the Mixpanel and Visible integration below:
Connect Your Mixpanel Account
From your Mixpanel account, find your API token and enter it in Visible. From here, select the metrics you’d like to track and visualize in Visible.
Visualize Your Product Analytics
Once your Mixpanel account is connected to Visible, use our chart builder to visualize, add insights, and customize your product analytics. Charts will automatically update as new data comes in from Mixpanel.
Combine with Other Data Sources
Connect to our 13+ other integrations to chart your core metrics from multiple sources in one place. For example, chart your Mixpanel data alongside data from Stripe or Google Sheets.
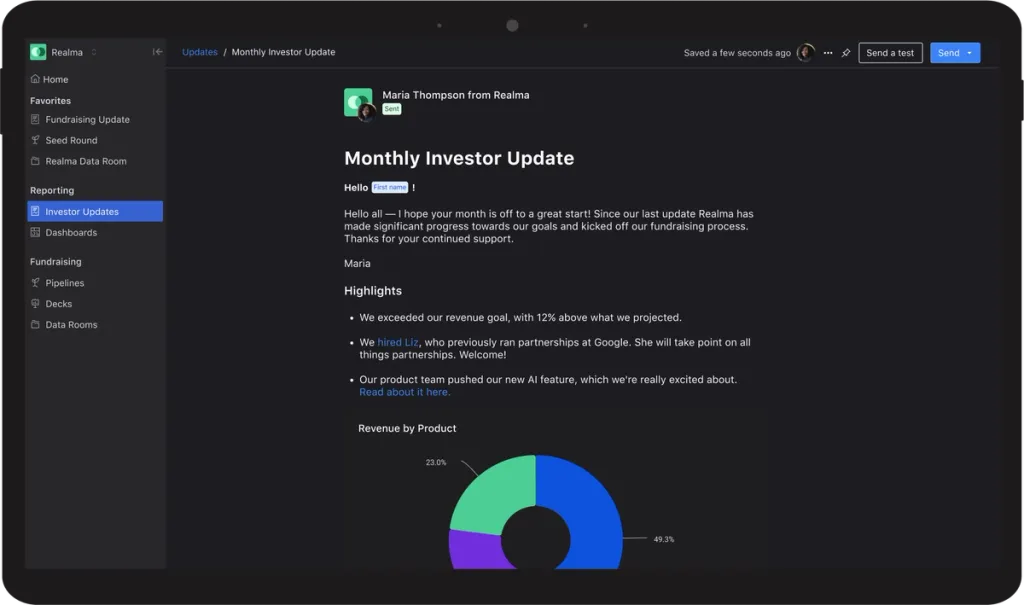
Share via Visible Updates, Dashboards, or Data Rooms
Easily share your data visualizations via Visible Updates, Dashboards, or Data Rooms. We allow you to push your data via email or link so stakeholders don’t have to remember another login.



Spend Less Time Fundraising. More Time Building.
Visible is the fundraising platform for founders. Run your raise from first pitch to close, keep investors warm between rounds, and get back to the work that matters.
Free Starter Plan. No credit card.