
Key Takeaways
- Fund performance metrics: A fund performance dashboard built for LPs tracks TVPI, DPI, RVPI, MOIC, and IRR alongside realized and unrealized fair market value, total invested, and capital called.
- Cross-portfolio distribution: A portfolio metric dashboard compares a single metric across every company and returns the total, minimum, maximum, median, and quartiles, filtered by a custom segment and a chosen time period.
- LP-facing branding: Custom colors and a choice of chart type let a fund send LPs a performance dashboard carrying the firm's own identity rather than a vendor's default chart styling.
As a venture capital investor, it’s critical to maintain accurate, up-to-date information about your portfolio companies and investment data. This helps investors make data-informed investment decisions, provide better portfolio support, fulfill audit requirements with relative ease, and not to mention, impress LPs.
What’s even better than just having your data well-organized and easy to find, is when investors can seamlessly turn that data into meaningful insights that are easy to share with internal team members and stakeholders.
Below we describe three different dashboard types supported in Visible that help investors surface and communicate important updates about their portfolio.
Flexible Dashboards for Internal Portfolio Reviews
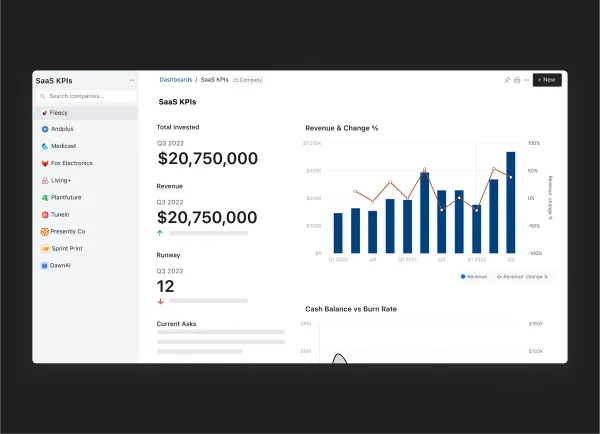
Flexible dashboards in Visible allow investors to integrate metric data, investment data, and properties directly into a dashboard. The flexible grid layout means investors have control over how they want to visualize and communicate updates to their team.
Investors commonly use these dashboards to facilitate internal portfolio review meetings which keeps their team up to date and engaged about important updates across the portfolio.
The underlying data is where most firms are stuck. S&P Global Market Intelligence's 2026 Private Equity and Venture Capital Outlook found 37% of general partners dissatisfied with the quality and availability of non-public operational metrics, with fragmented or unstructured data named as a key barrier.
View flexible dashboard examples in the guide below.
Fund Performance Dashboards for Communicating with LPs
Visible allows investors to track, visualize, and share key fund performance metrics. Investors can choose from 14+ different chart types and use custom colors to incorporate their branding into their dashboards.
The fund metrics supported in Visible include:
- TVPI
- DPI
- RVPI
- MOIC
- IRR
- Unrealized and realized FMV
- Total Invested
- Capital Called
- and more.
Learn about the 30+ fund metrics supported in Visible.
Related resource: VC Fund Performance Metrics 101
View a Fund Performance Dashboard example in the guide below.
Portfolio Metric Dashboards for Cross-Portfolio Analysis
As a venture capital portfolio grows, it’s helpful for investors to be able to pull quick insights across all their companies.
Christoph Janz of Point Nine Capital does this and points it back at the founder: "we do track some KPIs across the entire portfolio, and that helps, if we discuss some of these things with a founder, it might help them just get a broad sense for how are we doing in comparison to others."
Visible’s Portfolio Metric Dashboards let investors compare performance across the entire portfolio for a single metric. This view can be filtered by a custom segment and time period. Visible also automatically calculates quick insights such as:
- Total
- Min
- Max
- Median
- Quartiles
View a Portfolio Metric Dashboard in the guide below.
Visible’s dashboards give investors control over how they want to track and visualize their portfolio KPIs and investment data. Learn more about Visible.
Frequently Asked Questions
What is the difference between fund performance metrics and portfolio company metrics?
Fund performance metrics measure how the fund itself is returning capital to the people who invested in it, and portfolio company metrics measure how an individual company is performing. A fund reports the first set to its LPs and uses the second to judge and support the companies it has backed.
Why does a venture fund compare a single metric across every portfolio company at once?
Comparing one metric across the whole portfolio shows where a company sits against the rest, which reading company by company never surfaces. The comparison gets sharper when it is narrowed to a segment of companies that belong side by side and to a defined time period.
What data belongs on a portfolio dashboard built for a fund's investment team?
A dashboard for the investment team should hold the metrics companies report, the fund's own investment data, and the properties the firm tracks against each company, in one view. Pulling the three together is what lets the team read performance and position at the same time instead of moving between files.