Blog
Visible Blog
Resources to support ambitious founders and the investors who back them.
All
Fundraising Metrics and data Product Updates Operations Hiring & Talent Reporting Customer Stories

founders
Metrics and data
Key Metrics to Track and Measure In the eCommerce World
As eCommerce startups begin to evolve, so do the metrics and KPIs around them. In 2020 alone, eCommerce totaled over $4.2 trillion. With the explosion of Amazon, Shopify, Casper, Warby Parker, and Allbirds, shopping online has become the norm in the United States.
As more eCommerce and direct-to-consumer (DTC) companies begin to scale and exit, the funding options and growth plans are scaling as well. In order to best launch, scale, and fund your e-commerce startup you will need to make sure you have the proper metrics and key performance indicators (KPIs) in place to track and improve.
Related Resource: Our Google Sheet Template to Track eCommerce Metrics
Related Resource: 20+ VCs Investing in E-commerce and Consumer Products
Related Resource: Top Trends and Leading VCs Investing in D2C Brands: A Comprehensive Guide for 2024
Defining Metrics According to eCommerce
Tracking and monitoring metrics across the eCommerce sales & marketing funnel is vital. With thinner margins, a larger customer base, and less predictability than a software company, there are countless touchpoints and conversion points that eCommerce leaders need to keep their eye on.
Metrics are used to measure the overall health of your business. While some metrics can fall into the “vanity:” category, there are certain metrics that should be monitored and tracked to ensure your business is healthy. We’ll continue to dig into the most vital metrics for eCommerce metrics to track later in this post.
Defining Key Performance Indicators or KPIs in eCommerce
On the flip side, there are key performance indicators (KPIs) that can be tracked and monitored for an eCommerce startup. KPIs should be used to track individual objectives for your business that you believe are crucial to growth and success.
KPIs should be periodically updated and reviewed to make sure they are relevant to your most recent objectives. As the name implies, they should be “key” to the success of your business moving forward.
Related Resource: The Startup Guide To Building Successful OKRs (Examples Included)
KPI vs. Metrics: What’s the Difference?
As we previously mentioned, KPIs and metrics can have slightly different meanings and importance for your business. While metrics are something that naturally evolve and are tracked, they are generally used to measure the overall health of your business. Different metrics will have different levels of importance. Some metrics might be considered “vanity” metrics while others might be crucial to the success of your business.
On the flip side, we have KPIs that are intentionally picked and tracked to improve certain aspects of your business. KPIs are generally tied into a specific objective or goal for your business and is something you are focused on improving for periods of time.
As the team at BrightGauge puts it, “Let’s start with a basic tenet: metrics support KPIs. KPIs may be made up of a variety of different metrics that give you a full picture of your team’s progress toward a goal.
If the business goal is to create 20% more sales qualified leads (SQL) over the next year, original/new website visits alone may not provide you with the data you need. However, understanding how that metric translates into other site interactions, like form completions and downloads, is vital. If the analysis has created a correlation between downloads and SQLs, then website visitors and new downloads become KPIs rather than just metrics.”
How is eCommerce Success Measured?
Nowadays almost anyone can launch an eCommerce site but the key is to understand your customers and be able to make strategic decisions based on evidence. This evidence and your overall eCommerce success is measured through KPIs and various metrics. Also, it is important to understand that not all metrics are as valuable as others. Identifying the right KPIs to track will help you improve the overall success of your eCommerce business.
The Best eCommerce Metrics to Keep Track of
There are various metrics you can use to keep track of your success but this may vary based on the company. For most, we have seen these metrics be key and we’ve broken them down by categories:
Customer Breakdown Metrics (Impressions, Reach, Engagement), Acquisition Metrics (Email Click-Through Rate, Cost Per Acquisition or CPA, Organic Visitor Acquisition Rate, Social Media Engagement)
Customer Behavioral Metrics (Shopping Cart Abandonment Rate, Checkout Abandonment, Micro to Macro Conversion Rates, Micro to Macro Conversion Rates, Average Order Value or AOV, Sales Conversion Rate)
Customer Retention Metrics (Customer Retention Rate, Customer Lifetime Value or CLV, Repeat Customer Rate, Refund and Return Rate, Churn Rate)
Advocacy Metrics (H4 Net Promoter Score, Subscription Rate, Program Participation Rate)
A few years back Dave Ambrose, Managing Partner at Steadfast Ventures, shared a template full of KPIs for eCommerce startups and founders. Since Dave’s original template, we’ve surveyed a few of our customers and friends to make some tweaks and add in new metrics. Special thanks to Dave and the team at Italic for allowing us to share their key KPIs. Italic is an eCommerce company that sells “unbranded luxury goods straight from the source.” With $13M in venture funding and customers across the globe, it is vital for Italic to keep a tab on their metrics across the funnel.
Check out our Guide to E-Commerce Metrics (with Google Sheet Template)!
1) Customer Breakdown Metrics
Impressions, reach, and engagement track different elements of how your content is coming across to your audience (how many people see it, how often they see it, and how much they engage with it).
These metrics are important to track because it allows you to track your return on investment (ROI) and give you a clearer understanding overall of how well your content is performing.
Impressions
Impressions measures how many times your content showed up in front of someone’s eyes, regardless of whether they interacted with it or not (i.e how many times your ad showed up in their feed). Even if the same person saw it twice it would be recorded as two impressions.
Possible tools: Sprout Social, and Google Analytics, (can view total Web impressions).
Reach
Reach on the other hand tracks how many people saw your content- the qualification here is that the view is unique and every person is recorded only once. So even if the ad in someone’s feed showed up multiple times the reach would still be counted as one.
Possible tools: Sprout Social and Hootsuite
Engagement
This metric reveals how people are interacting with your content. Whether it be through a click, like, comment, or reshare- any and all interactions are recorded.
Possible tool: Hootsuite.
Acquisition Metrics
Acquisition metrics give you insight into how your social channels, content, and ads are performing in terms of customer acquisition.
Email Click-Through Rate
Click-through rate is a metric that tells you the percentage of people who clicked on a link within the email out of how many people opened it, to begin with. A click rate on the other hand measures this based on how many people were sent the email vs how many people opened it (the CTR).
Possible tool: Campaign Monitor
Cost Per Acquisition or CPA
When using a cost per acquisition model you paying for every action that your audience is completing whether that be a form submission, download, or sale. In short, if they click and convert from your ad you pay. Marketers prefer this method since you only need to pay once your customer completes the desired action.
When you are able to break down what your cost is per acquisition you are able to most accurately measure whether the content you creating is compelling enough for people to convert/ to what extent your audience wants to engage with it.
Possible tools and methods to track:
Generate link codes for affiliate marketing or social by utilizing UTM parameters
CRM systems such as Hubspot
Using AdWords to export PPC campaign data
Building custom links using promotional codes for internal campaigns
When submitting an action add a form field asking how your customer found the campaign
Organic Visitor Acquisition Rate
When someone lands on your website from an unpaid source (google/ any search engine) then this is considered organic traffic and results are driven through SEO (search engine optimization).
Landing Page Traffic gives you insight into the top pages that people are arriving at your website from. This lets you know what topics people are interested in and how well your pages are performing for SEO. Looking at bounce rates and session durations is also important to understand how engaged people are with your articles.
Possible tool: Insider and Google Analytics
Social Media Engagement
Tracking social shares, followers, comments, and likes is a good way to monitor how engaged your audience is with your social media content.
This is why there is a focus on creating quality content. If people like what you’ve created they are more likely to want to engage with your content, brand and eventually share it with their followers.
You can keep track of which channels and content are producing the most shares and convert them into leads. Then spend more time on the channels and types of content that your audience is engaging with most. Strong social signals also help you rank higher organically within Google.
Possible tools: Sprout Social, Hoosuite, and Falcon.io
Customer Behavioral Metrics
Customer behavioral metrics can give you some of the best insight into how customers are responding to your UX/ UI experience as well as your brand/ company. Monitoring their behavior and adapting to changes that might need to be made to help influence decision making, keeps you one step ahead and able to repeat mistakes that cause your customers to convert.
Shopping Cart Abandonment Rate
The shopping cart abandonment rate is the percentage of your customers that added goods to their cart and left before checking out.
Possible tools: Google Analytics allows you to set up cart abandonment tracking and Google sheets to set up cart abandonment measurement. Bolt’s article on how to set both of these up
Checkout Abandonment
Then there is checkout abandonment which is different than shopping cart abandonment because it tracks how far along in the checkout process a customer gets before they decide to leave. If they’re not advancing in the checkout process then they are essentially abandoning their shopping cart.
Micro to Macro Conversion Rates
Micro and Macro are the two main types of conversions (when a customer follows through with an action that you want them to take). Just as it sounds, a micro conversion is when a customer takes a small step or a macro- big step to converting. A micro conversion could be someone clicking a link or following you on a social channel. Whereas a macro conversion would be a customer taking the biggest step which is completing a purchase or creating an account.
Possible tool: Hotjar
Average Order Value or AOV
The average order value is the average amount that your customer spends each time they place an order. You can calculate this by dividing the total revenue by the total number of orders.
Sales Conversion Rate
This metric lets you know how many of your visitors or leads you are converting into sales (or any action that you want the user to take).
Sales Conversion Rate= Number of Sales (or conversions) / Number of (qualified) Leads(or visitors) *100
Customer Retention Metrics
Customer Retention metrics are important to track and always try to improve upon since new customer acquisition is more expensive and harder to obtain than keeping the customers you have happy and ensuring repeat business.
Additional resource: Hubspots 10 Customer Retention Metrics & How to Measure Them
Customer Retention Rate
A companies customer retention rate measures how many of your overall customers are repeat customers (someone who has purchased from you again).
Companies often incentivize this through loyalty programs, subscriptions and other incentives. Keeping customers happy also increases this rate which is why customer feedback surveys can be helpful as well.
Possible tools: Segment
Additional resources: Hubspots 6 Customer Retention Systems (& Why CRM Should Be One of Them)
Customer Lifetime Value or CLV
CLV indicates how valuable a customer is to you not just on a per purchase basis but over the entire period of your companies relationship with them(the revenue that one customer generates). If a company is able to increase this value is a huge growth driver.
Possible tools: ChartMogal and Hubspot (both are integrations that can be found within Visible- check out all our integrations here)
Additional resource: Hubspots How to Calculate Customer Lifetime Value
Repeat Customer Rate
Repeat customer rate gives you the percentage of customers that have made a purchase more than once.
How to calculate:
Repeat Customer Rate = the # of customers that made a purchase more than once over a given period of time / your total number of customers for that same period of time. Then multiply that by 100 to get the percentage.
Possible tools: Shopify and Stripe
Refund and Return Rate
The refund and return rate can be calculated as a percentage that shows how much was returned or refunded by customers who initially purchased your services or goods versus the total number that was sold within a certain period of time.
How to calculate:
Refund and Return Rate = total number returned / total number sold x 100
Churn Rate
Churn rate is also known as customer churn, is a metric that calculates the rate at which customers stop doing business with a company. Most often this relates to subscribers who discontinue their plans within a given time frame and is represented as a percentage.
Possible tool: ChartMogal
Additional resource: Our Ultimate Guide to SaaS Metrics
Advocacy Metrics
Advocacy metrics are important to the companies that want to put their customer first and provide solutions and strategies that fulfill their customer’s needs. Some companies even hire a customer advocate who analyzes the needs of their customers and helps to build a business strategy around that. Tracking the following metrics will also help give you insights into this.
Net Promoter Score
NPS is used to gauge the loyalty of a firm’s relationships. It can measure a company, employer or another entity. You have likely received an NPS survey yourself. It’s a score of 1 to 10 usually with a question of “How likely are you to recommend X to your friend or colleague?”
X could be your company, your customer support experience, an event, etc. If you answer 1 to 6 you are considered a detractor and at risk of customer churn, 7 & 8 are considered passives, and 9 & 10 are considered promoters. To get your score take % Promoters – %, Detractors. This creates a scale ranging from -100 to 100. 0 to 49 is considered good, 50 to 70 is Excellent and 70+ is World Class.
Additional resource: Why We Love Net Promoter Score (NPS)
Subscription Rate
This is the rate at which you are able to convert users into subscribers, usually paid but can also be a measure of email subscribers for instance. This can be measured to reflect different aspects of your business as well. For example, if you are a SaaS company, like ours, you may be measuring how many subscribers you have for your paid plan as well as how many people subscribe to your newsletter. The latter is also very important to us because it signals whether people find value and are interested in the content that we provide.
Program Participation Rate
The program participation rate refers to how many customers (or participants) you have enrolled in advocacy programs such as loyalty programs, referral reward systems, or take part in review platforms. The higher the number of participants reflects the greater value of the program.
Share Your eCommerce Growth with Contact Visible
Check out our E-commerce metric template- which all started a few years back when Dave Ambrose, Managing Partner at Steadfast Ventures, shared a template full of KPIs for eCommerce startups and founders. Since Dave’s original template, we’ve surveyed a few of our customers and friends to make some tweaks and add in new metrics
The setup of the template should be simple and ready to use and customize to your own liking out of the box. We’ve set the data to monthly but feel free to change to weekly, quarterly, etc. From here the template is broken down into 4 major metric categories — Customer Breakdown, Acquisition, Behavioral, and Operational.
Download the template here and also check out Our Guide to E-Commerce Metrics (with Google Sheet Template).
Additional Resources
From the Visible blog with a video: Shopify Ecommerce Dashboard
Sprout Social’s Social Media Metrics Map
Hootsuite’s 19 Social Media Metrics That Really Matter—And How to Track Them
Hubspot’s Free Download: Monthly Marketing Reporting Templates

founders
Hiring & Talent
Customer Stories
Looking Beyond a Candidate’s Resume with Malcolm Burenstam Linder
About Malcolm
Malcolm Burenstam Linder is the CEO and Co-founder of Alva Labs. The team at Alva Labs is creating a more fair and data-driven recruitment process. Malcolm joins us to break down his story and journey as a founder.
Episode Takeaways
A few key topics we hit on:
About Alva Labs and Malcolm
How Alva found their first customers
Using personal networks to find their first customers
Why founders need to be extremely diligent about their first hires
Why seeing a professional coach has been a gamechanger for him
Why everyone should look beyond a resume when hiring
Watch the Episode
Give episode 4 a listen below (or give it a listen on Spotify, Apple Podcasts, or wherever you normally consume podcasts):
Related resource: Why the Chief of Staff is Important for a Startup

founders
Operations
Unlocking the Power of Thoughtful Relationships with the Founders of Clay
About Matt & Zach
Matt Achariam and Zach Hamed are the Co-founders of Clay. Clay is a beautiful and private home for all your relationships. Populated from the ground up using your calendar and social history, Clay is the most stunning, powerful way to remember who you’ve met—and what matters to them.
Episode Takeaways
Matt and Zach joined us for season 3 of the Founders Forward Podcast to share their stories. Clay has scaled rapidly and has raised capital from the likes of Forerunner Ventures and General Catalyst. They join us to break down:
How they acquired their first customers
Why they manually onboarded their first users
Why they focus on the problem to better build product
Why founders should stop overthinking outreach
The importance of empathy in the startup world
Why you should compliment more people
A relationship-based approach to fundraising
Related Resource: Investor Outreach Strategy: 9 Step Guide
Watch the Episode
Give episode 3 a listen below (or give it a listen on Spotify, Apple Podcasts, or wherever you normally consume podcasts)

founders
Metrics and data
EBITDA vs Revenue: Understanding the Difference
Raise capital, update investors and engage your team from a single platform. Try Visible free for 14 days.
As the saying goes, “you can’t improve what you don’t measure.” The most successful startups have a system to track and improve the metrics and financials that are most vital to their business.
Before you can set up a system to track your key metrics, you don’t need to understand what specific metrics and financials you should be tracking. At the end of the day, revenue metrics are what makes a business tick. In order to best track your revenue metrics, you need to understand the nuances between different financials and metrics.
Related Resource: Startup Metrics You Need to Monitor
Learn more about the differences between revenue and EBITDA below:
What is the difference between EBITDA and revenue?
EBITDA (Earnings Before Interest, Taxes, Depreciation, and Amortization) and revenue are two financial metrics that all startup founders should be familiar with.
Simply put, revenue is the topline income a company is bringing in over a period of time. On the other hand, EBITDA is a financial metric used to help measure profitability. Learn more about the intricacies of both EBITDA and revenue below:
What is EBITDA?
As put by Investopedia, “EBITDA, or earnings before interest, taxes, depreciation, and amortization, is an alternate measure of profitability to net income. By stripping out the non-cash depreciation and amortization expense as well as taxes and debt costs dependent on the capital structure, EBITDA attempts to represent cash profit generated by the company’s operations.”
Related resource: What is a Schedule K-1: A Comprehensive Guide
How to calculate EBITDA
There are 2 common ways to calculate EBITDA. Both will generally use a combination of an income statement and a cash flow statement to pull the relevant metrics.
Calculate using operating income
The first way to calculate EBITDA is by using operating income. For this way, you can simply take operating income and add depreciation & amortization. It will look like this:
EBITDA = Operating Income + Depreciation & Amortization
Calculate using net income
The other common way to calculate EBITDA is by using net income. For this method, you’ll need a few more financials. Net income takes operating income and subtracts non-operating expenses (like interest and taxes) so you’ll need to add those back into EBITDA. It will look like this:
EBITDA = Net Income + Depreciation & Amortization + Net Interest Expense + Income Taxes
Why is EBITDA an important metric?
Oftentimes, EBITDA is considered one of the most important financial metrics that a company can track. This is because it removes any external forces that are impacting a business’s financials and is solely on its profitability trends. This helps companies determine their true valuation and can be easily used to benchmark against similar companies.
A more clear understanding of valuation, also means that the company can be properly priced to potential acquisition partners.
Related Resource: Startup Metrics You Need to Monitor
Pros and cons of EBITDA
Like any startup metric, EBITDA comes with its pros and cons. As we laid out above, EBITDA is important because it removes external forces and demonstrates the true financials of a business. When it comes to cons, EBITDA can sometimes lead to confusion.
A typical con is that EBITDA gives an unclear look at cash flow and can lead to a misleading understanding of how much cash is truly coming into the business.
What is revenue?
As put by the team at Investopedia, “Revenue is the money generated from normal business operations, calculated as the average sales price times the number of units sold. It is the top-line (or gross income) figure from which costs are subtracted to determine net income. Revenue is also known as sales on the income statement.”
At the end of the day, revenue is the lifeblood of a business. If a business is not bringing in new customers or expanding existing revenue, its livelihood will be short-lived.
Most projections and financials will start with revenue as it determines where the money can be allocated across the business.
Related Resource: 6 Metrics Every Startup Founder Should Track
Net revenue vs. gross revenue
Gross revenue is the total income a business brings in over a certain period of time. For example, if you should $5,000 worth of merchandise over the course of a month, your gross revenue would be $5,000.
On the flip side, is net revenue. This starts with gross revenue and subtracts your expenses. For example, in the example above your gross revenue is $5,000 and if you incur $2,000 in expenses over the same period – your net revenue would be $3,000.
How to calculate total revenue
Calculating revenue is very straightforward. To calculate your total revenue simply take the # of units sold and multiply it by the average price.
Why is revenue an important metric
As we mentioned above, revenue is the lifeblood of a business. At the end of the day, a business needs to generate revenue to fuel growth and sustain salaries, and develop new product. At the end of the day, without revenue, a business will cease to exist.
Related Resource: 6 Metrics Every Startup Founder Should Track
EBITDA vs. revenue comparison
As we laid out above, EBITDA and revenue are both important financial metrics for every business. However, making sure you are properly tracking and understanding your financial metrics is a must.
Learn more about the key differences and similarities between EBITDA and revenue below:
Key differences between EBITDA and revenue
EBITDA and revenue differ mostly in their purpose. On one hand, you have revenue. This is a true measure of sales and marketing activity and is simply based on the performance of your sales efforts.
On the other hand, you have EBITDA. EBITDA uses revenue as one of its functions and tailors it to measure your business’s profitability. This takes into account the performance of your business as a whole, not just your ability to add new revenue.
Key similarities between EBITDA and revenue
While the 2 metrics differ in what they track and measure, they are similar in the fact that they are valuable metrics that every startup should track. Because of their ability to measure how different aspects of your business, it is important to keep tabs on both.
Both metrics hold merit and should be used to evaluate different aspects of your business.
Which metric do investors prefer?
Like most things in the venture capital world, different investors will have different opinions when it comes to EBITDA. Revenue should be a given when it comes to what investors want to see. Investors, especially early stage and growth stage investors, expect to see solid revenue growth to grow into a massive company.
On the other hand, there are instances where investors will want to see EBITDA. As we’ve previously mentioned, EBITDA shows a company’s profitability and can be used when setting valuations so investors can have a better understanding of your company’s financial health.
Track and share your metrics effectively with Visible
Determining what metrics to track for your business is only half the battle. Having the right systems in place to track and share your key metrics is vital to growth.
Raise capital, update investors and engage your team from a single platform. Try Visible free for 14 days.

investors
Reporting
Customer Stories
How to Report to Limited Partners with Gale Wilkinson of Vitalize VC
Stay engaged with your founders right from your pocket. Monitor your portfolio and be the value-add investor you want to be with Visible for Investors. Learn more
One of the core responsibilities of a general partner (GP) is to report with both their Limited Partners (LPs) and portfolio companies. Gale Wilkinson, Founder of Vitalize Venture Capital, joined us to break down how their team engages with and reports to their LPs.
Why send LP Reports?
Just like any relationship, the LP <> GP relationship is all about trust. In order to better establish a relationship and improve the odds of raising capital for a future fund, GPs and venture funds need to have a system in place to report to and communicate with their LPs.
>> Check out Visible’s LP Template Library here.
Raise Future Capital
Not only are venture funds and general partners competing against other venture funds for LP capital, they are also competing against other asset classes. Of course, LPs will look back at your performance of previous investments but will also be judging you and your skills as a partner. Having a proven history of strong performance and communication is a surefire way to increase a GPs odds of raising funds.
Help Portfolio Companies
Different limited partners will offer different skill sets and opportunities. All portfolio companies are looking for help — that might be customer introductions, fundraising options, and hiring. Limited Partners can be a great source for VCs to help out portfolio companies. In turn, this only improves a founder’s relationship with the fund and improves their odds of success.
Due Diligence
Some limited partners will have a proven track record or expertise in the market. Because of this, they might understand the space even further and can help when it comes to due diligence and vetting potential investments. As Gale shares above, they have an LP that has expertise in workflow tech and help them with due diligence in the space.
How to create a tear sheet for your LPs
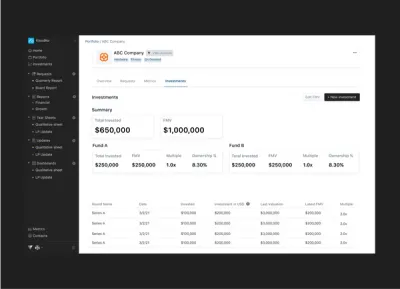
Gale and the team at Vitalize have done an incredible job of using tear sheets to help keep their LPs in the loop. The Vitalize team uses both the qualitative and quantitative data they collect from their portfolio companies and create a single page tear sheet for each company they can share with their LPs. Check out a few example tear sheets below:
A few things they include in their tear sheets:
Company Information
LPs are generally busy and have investments across many different asset classes. In order to help with them understand what a portfolio company does, be sure to include a quick description and the reason why you invested.
Qualitative Updates
The team at Vitalize also likes to include qualitative updates from each portfolio company. This is generally tied to revenue milestones but can also cover financing rounds and major hires.
Investment Information
Of course, LPs want to see the financials and information behind an investment. The team at Vitalize includes basic investment information like initial investment dates, capital invested, Vitalize’s value, and more.
Core Metrics
Using the KPIs and data that the Vitalize team collects from their portfolio companies they build a simple table that shows a companies quarterly performance. A few of the metrics the Vitalize team tracks and shares are:
Revenue
COGs/COS
Gross Margin %
Total Expenses
EBITDA
Cash Balance
Months of Runway
LP Reporting Templates to Get You Started
Ready to take your LP reporting to the next level? Check out our LP Reporting Templates to get you started. Or schedule a call with our team to learn more here.

founders
Fundraising
Reporting
Valuing Startups: 10 Popular Methods
Every startup is aiming for a high valuation for their business. In business, valuation is the process of evaluating the present value of the asset in hand, in this case the overall value that a startup is worth. For startups, there are a variety of popular methods folks use to evaluate a business and determine its overall valuation. Different valuation methods are used for different reasons. To help break it down, we’ve outlined 10 popular methods for valuing startups.
Related Reading: Pre-money vs Post-money: Essential Startup Knowledge + 409a Valuation: Everything a Founder Needs to Know
1. The Berkus Method
Startups are risky. Less than 10% of startups make it past the first year of existence so determining the valuation of a startup, especially a brand new one with only months of lifespan can be extremely challenging. The Berkus Method is an attempted way to assess value without the traditional revenue metrics that many methods take into account for more mature organizations.
The Berkus Method quantifies value by assessing qualitative qualities instead of quantitative ones. Value is assessed in the Berkus Method with five main elements. The elements considered within the Berkus Method include value business model (base value), available prototype to assess the technology risk and viability, founding team members and their abilities or industry knowledge, strategic relationships within the space or team, existing customers or first sales that prove viability. A quantitative value can be tied to each relevant quantitative factor with the Berkus Method.
Source: Angel Capital Association
Pro Tip: When To Use This Method
The Berkus Method should be used pre-revenue. It can be a valuable valuation method when a new startup is formed with expert founders or former successful startup leaders at the helm or when a strong, viable product is in place. In these examples, there is enough qualitative information at hand to justify a quantitative value.
Related Resource: What is Pre-Revenue Funding?
2. Comparable Transactions Method
This valuation method at the highest level is essentially valuing the business based on what consumers would currently pay for it. This is one of the most conventional methods of valuation. To make a comparable transaction valuation, an investor or evaluator will look at companies of a similar size, revenue range, industry, and business model and see what they were valued at or sold for. This method is looking at validation from what others were willing to pay for similar companies in an acquisition or merger and use that to make a fair, or comparable, offer on the company seeking valuation.
Pro Tip: When To Use This Method
The most common scenario where the Comparable Transaction Method might be used is through a big M&A (Merger and Acquisition) deal.
3. Scorecard Valuation Method
When a company hasn’t produced any revenue yet, as an early-stage startup, it can be hard for investors to make a solid bet on the probability of their investments’ success. The Scorecard Valuation Method is one method that relies on the past investments of others taking similar bets and risks on pre-revenue startups. Similar to the comparable transaction method, the scorecard valuation method looks at similar startups or companies in the company at questions’ industry.
This valuation method looks at these similar companies and sees what types of valuation they received by other investors. From there, the median will be calculated from the value of all the similar companies’ valuations and this median will determine the average value of the target company. In addition to the median value placed on the competitive landscape, scorecards are looking at the strengths and weaknesses of the market as assessed by other investors and scoring their investment in question weighted with the following criteria compared to the other companies in the space:
Board, entrepreneur, the management team – 25%
Size of opportunity – 20%
Technology/Product – 18%
Marketing/Sales – 15%
Need for additional financing – 10%
Others – 10%
A company may be valued higher than the median with the scorecard method if the size of opportunity or board/management team is exceptional quality or vice versa, maybe docked if the tech is strong but the leadership is assessed as in-experienced.
Pro Tip: When To Use This Method
This method may be used by a startup that is in a crowded space such as marketing tech, sales tech, fintech etc.. and is pre-revenue; With a lot of similar or adjacent companies raising rounds and receiving valuations, a scorecard can be used successfully because there are is a lot of adjacent validation in the market.
4. Cost-to-Duplicate Approach
Startups are a risky investment for many reasons, but one big one is that it typically takes a lot of capital to run and scale a business and many startups struggle to manage their run rate and burn rate efficiently.
The Cost-to-Duplicate Approach to valuation considers all costs and expenses associated with the startup. The costs and expenses reviewed include the development of the product and the purchase of physical assets. A fair market value is then determined based upon all the expenses at hand. The negative of using this type of valuation approach is that it does not consider the future growth and potential of the company, only the current efficiency based on expense and it also doesn’t take into account intangible assets such as the talent of the leadership team, brand, patents, etc.
Pro Tip: When To Use This Method
The Cost-to-Duplicate Approach might be the right approach to asset valuation when the product is simple and won’t require a lot of expensive development, the team is lean and the burn rate of capital is extremely slow or even non-existent. Lean startups with one or two folks at the helm, or with a founding team that isn’t taking a salary yet could use this method to justify their first infusion of cash to start taking a salary or start making bigger financial moves.
5. Risk Factor Summation Method
Every venture capital fund or any investment firm is spending time unpacking the potential risks of each and every new investment they make. The Risk Factor Summation Method is used with risk as the primary method for evaluation. This approach values a startup by taking into quantitative consideration all risks associated with the business that can affect the return on investment.
An initial value is calculated (possibly even using one of the other methods discussed in this post) and then the risks are assessed, deducting or adding to the initial value calculation based on said risks to the return. Some of the different kinds of risks that are taken into account are management risk, political risk, manufacturing risk, market competition risk, investment and capital accumulation risk, technological risk, and legal environment risk.
Pro Tip: When To Use This Method
This method is often used by investors when looking at a new space or as a second pass on assessing the value of a potential investment.
6. Discounted Cash Flow Method
This method is predicting the valuation of a company based on its assumed future cash flows. The hope is that the DCF (Discounted Cash Flow) is above the current cost of investment resulting in projected positive return and higher valuation. A discount rate is used to find the value of present future cash flows.
For example, the discount rate might be the average rate of return that shareholders in the firm are expecting for the given year. That percent (maybe 5%, 10%, etc.) is then used to make a year-over-year assumption. This hypothetical informs investors that based on the current cash flow and discount rate chosen to asses, the expected cash flow can be anticipated from this investment.
Pro Tip: When To Use This Method
This is a great valuation method to use for a company that has relatively predictable and stable up and to the right growth up until the time of investment.
Related resource: Discounted Cash Flow (DCF) Analysis: The Purpose, Formula, and How it Works
7. Venture Capital Method
This method is one of the most common, if not the most common method used for evaluating startups that are pre-cash flow and seeking VC investment. The VC Method looks at 6 steps to determine valuation:
Estimate the Investment Needed
Forecast Startup Financials
Determine the Timing of Exit (IPO, M&A, etc.)
Calculate Multiple at Exit (based on comps)
Discount to PV at the Desired Rate of Return
Determine Valuation and Desired Ownership Stake
Its ultimately a quick, rough estimate informed by as much information as is available based on the market, comps, any existing quantitative and qualitative info from the company at hand, and an assumed amount of risk from the VC Firm.
Related Resource: A User-Friendly Guide on Convertible Debt
Pro Tip: When To Use This Method
Most startups should expect that this valuation method will be applied when seeking early rounds of funding, especially from popular venture capital funds.
8. Book Value Method
The Book Value of a company is the net difference between that company’s total assets and total liabilities. The idea of this valuation method is to reflect what total value of a company’s assets that shareholders of that company would walk away with if that company was completely liquidated. Book Value is equated to the carrying value on a balance sheet. To calculate book value, look at the total common stockholder’s equity minus the preferred stock and then divide that number by the number of common shares in a company.
Pro Tip: When To Use This Method
This valuation is extremely helpful in determining if a company’s current stock value is under or overpriced when attempting to determine overall valuation.
9. First Chicago Method
Named after the VC arm of The First Chicago Bank, this valuation method uses a combo of multiple-based valuation and discounted cash flow to make a valuation of a company. Essentially, this method allows you to take into account many different possible outcomes for the business into the valuation – to keep it simple, you can think of this method as taking into consideration the business’s best case scenario, worst-case scenario, and average scenario.
Looking at all 3 scenarios, an estimate is made as to how likely each scenario is. Next, you multiply the probabilities by their respected values and add them up. This gives you a weighted average valuation from the combo of the 3 most likely scenarios – valuing the business on the average of what will probably happen.
Pro Tip: When To Use This Method
This valuation method is recommended for dynamic, early-stage growth companies. It’s used when companies have a future with many possible outcomes that could come about based on the next decisions made.
10. Standard Earnings Multiple Method
A multiple is a fraction in which the top number (the numerator) is larger than the bottom number (the denominator). The earnings of a business are defined as income or profit. The Standard Earnings Multiple Method looks at the earnings of the business over an industry-standard multiple. Every industry and sector may have a slightly different average multiple.
Pro Tip: When To Use This Method
One common scenario where this method is used is to measure stock pierce earnings with price/earnings ratio, which measures stock price to earnings. P/E ratio tells what the market (stock buyers) are willing to pay for the company’s earnings with a higher ratio indicating that people are willing to pay more.
Share Your Startup Valuation With Visible
Use Visible to communicate with your current investors. Raise capital, update investors and engage your team from a single platform. Try Visible free for 14 days.
Related Resources:
A Complete Guide on Founders Agreements
Who Funds SaaS Startups?
Types of Venture Capital Funds: Understanding VC Stages, Financing Methods, Risks, and More
Top Creator Economy Startups and the VCs That Fund Them
investors
Product Updates
Product Update — Improve Your Fund Analytics with Multiple Funds
We’re excited to share that our Multiple Funds feature is now live. This means you can now drill into your investment data and fund analytics with even more precision than before.
Assign investments to different funds to view and compare individual fund analytics. Slice your data even further with custom segments. Answer questions like “How does the multiple for our SaaS companies from Fund I compare to the multiple for our SaaS companies in Fund II” in seconds.
Get started with Multiple Funds within your Visible account or schedule a call here to learn more.

founders
Operations
Customer Stories
How This Founder Leveraged Social Proof to Grow Their Customer Base
About Yaw
Yaw Aning is the CEO and Founder of Malomo. Malomo is a shipment tracking platform that helps eCommerce brands turn order tracking from a cost center into a profitable marketing channel.
Episode Takeaways
Yaw joined us for season 3, episode 2 of our Founders Forward Podcast to dive into his career as a founder. He started his career in consulting which eventually led him to founding Malomo. Since founding Malomo, the team has rapidly grown and they’ve raised $8M+. Before ever thinking about funding, Yaw and the team had to determine what problems they were going to solve and did everything in their power to find their first customers.
Yaw joins us to break down:
How Malomo found their first customers
The importance of finding a co-founder
How and why you need to solve customer’s problems
How Yaw found his co-founder
The importance of being able to shut down
How to prioritize time
Watch the Episode
Give episode 2 with Yaw Aning a listen below (or give it a listen on Spotify, Apple Podcasts, or wherever you normally consume podcasts)
The Founders Forward is Produced by Visible
Our platforms helps thousands of founders update investors, track key metrics, and raise capital. Try Visible free for 14 days.

founders
Operations
The Main Difference Between ISOs and NSOs
Hiring and attracting top talent is a major responsibility of any startup founder. In order to compete with large corporations, startups oftentimes have to get creative to attract top talent.
One of the top benefits a startup can offer is employee stock options. This gives an employee potential upside and ultimately aligns both parties. There are two major forms of stock options — NSOs (non-qualified stock options) and ISOs (qualified incentive stock options).
How do you know what type of stock options to use for your company? Check out our breakdown of both ISOs and NSOs below:
Note: We always recommend seeking advice from lawyers or councils when working with your equity.
What Are Qualified Incentive Stock Options or ISOs?
As put by the team at Investopedia, “An incentive stock option (ISO) is a corporate benefit that gives an employee the right to buy shares of company stock at a discounted price with the added benefit of possible tax breaks on the profit. The profit on qualified ISOs is usually taxed at the capital gains rate, not the higher rate for ordinary income. Non-qualified stock options (NSOs) are taxed as ordinary income.”
The main difference between ISOs and NSOs are the tax structure and possible benefits. Traditionally, ISOs are awarded to high-value employees.
How Are ISOs Taxed?
As mentioned above, ISOs are taxed at the capital gains rate. This means that ISO holders are subject to tax benefits as the capital gains rate is generally lower than the ordinary income rate. It is worth noting that ISOs are taxed at the time of selling the stock (not when vesting or exercising).
When an employee (or person) is granted sock options there is a strike price (which is the value at the time of granting). Once an employee decides to exercise their options, they have the ability to sell their stock or hold on to the stock. If the same person sells their stock at (the fair market value) at a later date the difference between the strike price and fair market value is the profit — or what the employee is taxed on.
Check out the long-term capital gains tax rates in 2022 (for the US) below:
Learn more about other tax implications and the alternative minimum tax (AMT) in our next section.
The Impact AMT Has on ISOs
According to the IRS, “The alternative minimum tax (AMT) applies to taxpayers with high economic income by setting a limit on those benefits. It helps to ensure that those taxpayers pay at least a minimum amount of tax.” So what does this mean for ISOs?
While very rare and generally reserved for high-earning individuals, the AMT can be triggered if the profile from selling ISOs is large enough. This means that the stock seller will be subject to more taxes and negate some of the benefits of an ISO.
What Are Non-Qualified Stock Options or NSOs
On the flip side are non-qualified stock options (NSOs). As put by the team at Investopedia, “A non-qualified stock option (NSO) is a type of employee stock option wherein you pay ordinary income tax on the difference between the grant price and the price at which you exercise the option.” NSOs are generally more common than ISOs.
While they might not have the tax benefits of ISOs, NSOs are generally more common than ISOs and offer their own benefits. It is worth noting that NSOs can be granted to non-employees as well (board members, advisors, mentors, customers, etc.) Learn more about NSOs and their tax structure below:
How Are NSOs Taxed?
The main difference between NSOs and ISOs comes down to how they are taxed. If you recall, ISOs are only taxed at the capital gains tax when they are sold. NSOs can potentially be taxed on two occasions.
To start, NSOs are taxed when the stock options are initially exercised. If/when someone decides to exercise their NSOs they will pay a tax on the difference between the fair market value and the strike price.
Next, NSOs are taxed when someone sells the actual stock — similar to ISOs. Depending on how long someone holds their stock between the time they exercise it and sell it, will determine if they pay short term or long term capital gains tax.
The Impact AMT has on NSOs
As we mentioned earlier, an alternative tax minimum (AMT) is a potential downside of ISOs. Unlike their counterpart, NSOs are not subject to AMT.
ISO vs NSO Which One is Right For You?
Now that we understand the difference between qualified incentive stock options (ISOs) and non-qualified incentive stock options (NSOs) it is time to understand how and when you should be using both. Both have expected use cases and their own set of pros and cons depending on the use.
Related Reading: How to Fairly Split Startup Equity with Founders
When to Choose an ISO
Of course, most employees will likely want an ISO plan as it offers tax benefits. However, it is lesser used and should be reserved for high-value employees. As the team at Investopedia writes, “This type of employee stock purchase plan is intended to retain key employees or managers.” A few times for when you should choose a qualified incentive stock option for your employees:
When offering stock options for an employee (ISOs are not eligible with individuals who are not employees)
When trying to incentivize and retain a high-value employee — this might be a manager or executive that is closely aligned with your companies success.
When your company is in a financial position to offer ISOs instead of NSOs
When to Choose an NSO
While they do not necessarily have the tax benefits of ISOs, NSOs are widely used and are more common than ISOs. Below are a few examples and pros of choosing an NSO instead of an ISO:
When issuing stock options to non-employees. This could be consultants, board members, mentors, and more.
From the team at Pasquesi Partners, “With NSO, companies are able to take tax deductions when the employee chooses to exercise their option in the stock. Because of the way they are structured, NSO earnings are viewed as income for the employee, hence the tax deductions.”
When looking for a more simple option and straightforward stock option to offer employees
Share Stock Option Information With Your Investors with Visible
No matter how you structure your cap table and share equity with investors, employees, and more, it is important to be straightforward and transparent the entire time.
Want to improve your investor reporting and communication? Let us help. Raise capital, update investors and engage your team from a single platform. Try Visible free for 14 days.

founders
Fundraising
A Quick Overview on VC Fund Structure
Startups have different options when it comes to financing. One of the most popular options is venture capital. To better understand if venture capital is right for your business, check out our breakdown of different types of venture capital below.
If you believe you are ready to raise venture capital, understanding how and why the function will improve your odds of raising capital. To learn more about raising venture capital, check out our “All-Encompassing Startup Fundraising Guide.”
Related Resource: Types of Venture Capital Funds: Understanding VC Stages, Financing Methods, Risks, and More
What are the Types of Venture Capital Funding?
As venture capital continues to grow and evolve so do the types and expectations of funds. As the team at Crunchbase found, venture funding by year is growing, mainly between early-stage and late-stage funds:
Related Resource: Exploring VCs by Check Size
Learn more about different types of funding below:
Seed Capital
Seed funding, which oftentimes includes “pre-seed” funding, is generally the first round of financing for a startup. There typically tend to be funds that specialize in pre-seed/seed-stage financings.
However, as the seed stage has continued to grow so have the funds — later stage funds are now moving their way down to make seed investments. As the team at Crunchbase put, “One of the reasons many venture firms are stockpiling funds to invest into seed startups is that getting in at the earliest stages with a young startup lets those investors have a say in crucial decisions early on.”
Check out the average seed size (from “large” investment funds) over the last 10 years below (from the team at Crunchbase):
VCs will typically get more attractive terms as they are taking on more risk at the seed stage. Because of this, seed-stage investors oftentimes make more investments in the hopes that a small percentage of their investments will turn into huge returns (learn more about the power-law curve in VC here).
Related Resource: Seed Funding for Startups: A 101 Guide
Early Stage Capital
Post seed or pre-seed funding comes to Series A and Series B funding. While some might categorize them as a later stage, both are earlier stage financings that come post-seed round.
Early-stage capital is often when a company might have some traction and promise that it can grow into a massive company that is worthy of an exit.
Related Resource: How to Model Total Addressable Market (Template Included)
Related Resource: The Rise of Venture Capital in Utah: A Look at Utah’s Top 10 VC Firms
Related Resource: Breaking Ground: Exploring the World of Venture Capital in France
Expansion Capital
Once a company has proven they have product-market fit, a massive market, and a repeatable sales process — chances are they are ready to expand. With this comes larger check sizes that will help you put your growth strategies to work.
Venture funds at this stage are likely huge funds that make fewer investments with larger check sizes. At the point of investment, most companies will have proven success to in turn will raise at higher valuations.
Related resource: Understanding the Role of a Venture Partner in Startups
Late Stage Capital
Lastly comes late-stage capital. These are borderline private equity funds and can be used to bridge financings for larger companies. This might be a final injection before a company sets to go public or to fund expansion into a totally new market.
Related Resource: Private Equity vs Venture Capital: Critical Differences
Rolling Funds
More recently, “rolling funds” have become a point of interest in the space. While they are not typically dedicated to a specific stage (like the examples above) the way they raise financing and treat the general partner to limited partners relationship differs. Learn more about rolling funds here.
Related Resource: 12 Venture Capital Investors to Know
Venture Capitalist Fund Structure
To better improve your odds of raising venture capital, you need to understand how they function. When pitching investors you’ll want to keep a few of these things in mind so you can fit into their duties as a VC.
Check out a visual of how venture capital funds are structured below:
Related Resource: A Guide to How Venture Capital Works for Startups and New Investors Guide
A couple of key terms to understand when it comes to a venture funds structure:
1) Venture Fund
As the Bank for Candian Entrepreneurs puts it, “A venture capital (VC) fund is a sum of money investors committed for investment in early-stage companies.” A venture fund is simply capital that is ready to be deployed by the venture capital firm (or the management company).
2) Management Company
The management company is the people behind the fund itself. Not be confused with a venture fund. A venture management company can raise multiple funds. As the team at AngelList writes, “A management company is a business entity created by a venture firm’s general partners (GPs). It’s responsible for managing a venture firm’s operations across its funds.”
Management companies often receive a management fee from their funds to help deploy and grow their funds.
A management company is responsible for prospecting investments, collecting fees and expenses, branding, and more.
3) General Partner (GP)
A general partner is someone who manages a venture fund and likely the management company. As defined by the team at Angel List, “A GP is a manager of a venture fund. They may be a partner at a large VC firm like Sequoia, or an individual investor using AngelList. Like fund managers in other arenas (stocks, mutual funds, crypto, etc.), they analyze potential deals and make the final call on what to do with the money they manage.”
General partners are typically paid between their carried interest and management fees. Carried interest is typically where a general partner makes a living. Typically carried interest for a GP is 20% which means that 20% of a funds profits will be paid to the GP.
It is worth noting that GPs oftentimes invest their own money so they have skin in the game. You can boil down a general partner’s responsibility into 2 key things — deploying capital in high-quality companies and raising future capital.
4) Limited Partners (LPs)
You might be asking yourself where does capital for a venture fund come from? The answer is limited partners. Limited partners are generally much larger funds and are looking to diversity their investing via venture capital funds. Traditionally, limited partners tend to be:
University endowments
Sovereign funds
Family offices
Pension funds
Insurance companies
Etc.
Because VC funds are competing with traditional assets, it is vital that they provide outsized returns to improve their odds of raising venture capital in the future. Learn more about the power law curves in our post, “Understanding Power Law Curves to Better Your Chances of Raising Venture Capital.”
5) Startups
Of course, there are the actual startups and investments that a venture fund are making. For a startup to be deemed venture-worthy they generally have to operate in a large market, have promising economics, and the ability to create a massive return for their investors (and their LPs).
Related Reading: Building A Startup Financial Model That Works
Limited Partnerships & LLCs Role in VC Fund Structure
As the team at Investopedia puts it, “A limited partnership (LP)—not to be confused with a limited liability partnership (LLP)—is a partnership made up of two or more partners. The general partner oversees and runs the business while limited partners do not partake in managing the business. However, the general partner of a limited partnership has unlimited liability for the debt, and any limited partners have limited liability up to the amount of their investment.”
Because LPs do not partake in managing the business (e.g. the venture firm) they are relying on the GP and venture firm to be experts at investing. At the end of the day, every venture fund and firm wants to set out and raise a new fund every 10 years or so. This means that GPs need a strong record with LPs so when they seek further capital they have someone they can lean on.
This also means that LPs are expecting massive returns as they are trusting and deploying their capital with a general partner, likely in a space lesser-known to them.
Related resource: What is a Capital Call?
Three Examples of How Returns Are Generated
Of course, the goal of any venture fund is to generate returns for its limited partners. As we put in our post on power-law curves,
“A small % of VC funds take home a large % of venture returns. VCs are constantly working to make their way into the “winning” part of the curve so they can continue to attract capital from limited partners.
How does a VC fund become a “winner?” The best VC funds portfolio returns also follow a power-law curve. A small % of a VC funds investments will yield the majority of their returns.”
This means that VCs need to create liquidity and get returns to their investors so they can go out and raise capital again. This generally comes in 1 of 3 ways:
Related resource: Carried Interest in Venture Capital: What It Is and How It Works
1) Mergers and Acquisitions (M&A)
One of the most common ways that a startup exits are via a merger or acquisition. As put by the team at Investopedia, “Mergers and acquisitions (M&A) is a general term that describes the consolidation of companies or assets through various types of financial transactions, including mergers, acquisitions, consolidations, tender offers, purchase of assets, and management acquisitions.”
The terms of the merger or acquisition will impact how a VC is paid back. For example, an investor that invested at the seed stage will likely be greatly diluted if the exit is later in a companies lifecycle.
Related Resource: From IPOs to M&A: Navigating the Different Types of Liquidity Events
Related resource: What is Acquihiring? A Comprehensive Guide for Founders
2) A Buyout of Shares
Less common is that startups shares will be bought out. This means that a new entity is taking a larger or majority stake in a company. This could come via a specific fund exiting their position or a founder finding liquidity. No matter the case, the terms, and conditions will greatly impact any fund.
3) Startup Reaches an IPO
Lastly, there is an IPO (initial public offering). Becoming rarer, an IPO has the opportunity to create huge returns for a venture capital fund — especially their seed and early-stage investors.
Looking To Get Funding for Your Startup?
Understanding if venture capital is right for your business is a small part of the battle. Determining how to raise capital, what investors to raise from, and pitching investors is where the real fun begins. Having a system in place to raise venture capital is a great way to increase your odds of raising capital.
Related Resource: All-Encompassing Startup Fundraising Guide
Related Resource: 8 Most Active Venture Capital Firms in Europe
Related Resource: 7 Best Venture Capital Firms in Latin America
Related Resource: Exploring the Growing Venture Capital Scene in Japan
If you’ve read this post and determined that venture capital is a good fit for your company, let us help. Raise capital, update investors and engage your team from a single platform. Try Visible free for 14 days.

founders
Metrics and data
Customer Stories
Getting Over the Cold Start Problem with Nick Loui of PeakMetrics
We are back with another season of the Founders Forward Podcast! This season is all about founders in our community. Our goal is to sit down with startup founders and break down 3 things that have transformed their career or company.
About Nick
We’ll try to keep the episodes to 10 minutes or less so you can get back to what matters most — building your business.
For the first episode, we welcomed Nick Loui, CEO and Founder of PeakMetrics. PeakMetrics uses machine learning to spot trends & predict message resonance across news, social, and TV/radio. In this episode, we break down:
Episode Takeaways
Getting over the cold start problem
Creating value through aggregation
Narrowing down your target audience
Watch the Episode
Give episode 1 with Nick Loui a listen below (or give it a listen on Spotify, Apple Podcasts, or wherever you normally consume podcasts)
The Founders Forward is Produced by Visible
Our platforms helps thousands of founders update investors, track key metrics, and raise capital. Try Visible free for 14 days.

investors
Reporting
Customer Stories
[Webinar Recording] Best Practices for Portfolio Monitoring & Reporting With Gale Wilkinson
As more capital flows into venture as an asset class, investors increasingly compete for LP dollars and space on the cap table from the best founders they work with. Gone are the days when capital is enough of a differentiator for a VC fund to get on a hot startup’s cap table.
Considering the average VC + Founder relationship is 8-10 years (longer than the average marriage in the US) — founders are beginning to look for a true partner out of a VC fund. For a VC fund or emerging fund manager to stand out among other funds, they need to have the optimal data and systems in place.
Gale Wilkinson, Managing Partner and Founder of Vitalize Ventures, has led investments in over 70 companies and deployed $50M+ of capital. During her time at Vitalize and Irish Angels, Gale has turned into a leader in the space as emerging managers and founders turn to her for advice on all aspects of fund and startup building.
Gale joined us on February 15, 2022 to discuss how and why VC funds should build a system to track and monitor their portfolio companies.
Topics discussed during the webinar include:
The history and founding of Vitalize Ventures
The resources, network, communities, that has Gale has leveraged as she grows her managing partner skillset
How she put together the Vitalize tech stack
What metrics and data she collects from portfolio companies
How she reports portfolio performance to her LPs
Visible for Investors is a founders-first portfolio monitoring and reporting platform. Schedule time with our team to learn more.
founders
Fundraising
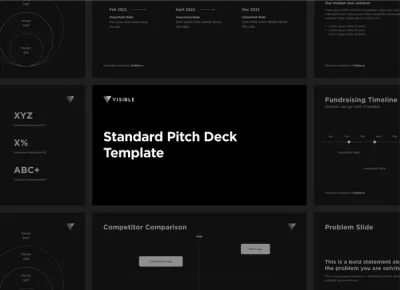
Our Teaser Pitch Deck Template
When communicating with investors in your fundraising funnel you will need to make sure you are telling a compelling story as to why they should invest in you.
Pitch decks are a powerful tool that can help you tell that story. Different investors will have different opinions about pitch decks. Some investors might want to receive them before the meeting, some might only want them sent via PDF or link, and some investors might not care if you have a pitch deck at all.
Through all of the noise one idea we have seen emerge is having a send away (or email deck) founders can share with investors before a meeting. Brett Brohl of Bread & Butter Ventures recommends a 4 or 5 slide deck that can be easily shared with potential investors.
While there is no prescriptive pitch deck template that will work for every startup, here is a 5 slide example email deck we have seen work well for founders (or check out the example deck directly in Visible here):
Slide 1 — Title Slide
Pro tips:
Make sure your logo is high quality and easy to read
Feel free to include a one sentence description of what your company does
Want to use this template? Download here.
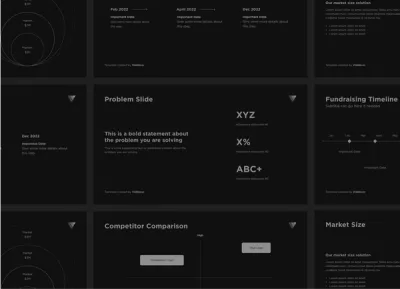
Slide 2 — Problem Slide
Pro tips:
Clearly articulate your problem
Use data to demonstrate how big the problem is
Use stories and pain points to build empathy from investors
Want to use this template? Download here.
Slide 3 — Solution Slide
Pro tips:
Clear overview of what your solution is
Use data and stories from customers to help investors understand why your solution is best
Want to use this template? Download here.
Slide 4 — Market Slide
Pro tips:
Make sure to use a bottoms up approach when modeling TAM (more from Gale Wilkinson here)
Show the market in dollars
VCs need huge exits — demonstrate why you can win your market
Want to use this template? Download here.
Slide 5 — Team Slide
Pro tips:
High quality headshots for key teammates
Include relevant experience and skills
Want to use this template? Download here.
Related Resources:
Visible Connect, our investor database
Building Your Ideal Investor Persona
How to Build an Investor List with Gale Wilkinson of Vitalize
All Encompassing Startup Fundraising Guide
Investor NPS: How likely are you to refer your current lead investor to fellow founders?
Some Advice Before You Hit the Fund Raising Trail
founders
Fundraising
How To Build a Pitch Deck, Step by Step
Pitch Decks are put together by startup founders when they are seeking a round of investment funding to back their business. A Pitch Deck tells the story of your company, the problem it solves, why it matters, and most importantly why a potential investor should care and want to donate thousands if not millions of dollars. Every investment a venture fund or private investor makes is a calculated risk and a strong pitch deck is often the key tool a founder has to showcase the risk is worth it.
Investors care about how they are going to make their money back plus a profit and want to see in your pitch deck how this will be possible for them. However, According to TechCrunch, investors only spend on average only 3 minutes and 44 seconds reviewing a pitch deck. Other sources have found that time to be less than 2 minutes. Its a safe bet to assume you have less than 5 minutes of an investor’s time to articulate why your company deserves their backing so taking the time to build a pitch deck that packs a punch in 5 minutes or less is critical.
Communicating all that you need to in a pitch deck, to summarize why your business is worth a big investment, is much easier to do in concept than in practice. A strong pitch deck should be simple and clear but still compelling. Building a strong pitch deck is a skill founders should take time to learn as early on as possible to ensure every 5 minutes or less spent on their deck by VCs gives the best chance for investment and future success. To assist, we’ve built out a step-by-step guide to help you build a quality pitch deck for your business.
Related Resources: 23 Pitch Deck Examples for Any Startup
1. Choose the Right Tools
Let’s take it from the beginning – choosing the right presentation tool to build your pitch deck. This may seem like a small decision, but in reality, there are pros and cons to building your pitch deck on different presentation solutions.
Keynote
This might be the best tool if you’re going to have a brand or product designers working on your deck. Keynote comes installed on all Mac computers and has tools and functionality that is a bit more detailed and flexible allowing trained designers to create custom, clean, original designs and layouts. If you’re not a designer or don’t have design resources available for your deck creation, Keynote may not be a strong choice as it can be a bit hard to navigate and collaborate on without the knowledge and eye for all of its features.
Google Slides
Google Slides is a strong free option for crafting simple decks. Anyone can use Google Slides and collaboration is seamless. If you’re a solo founder or an extremely lean, cash-strapped team without design resources, Google Slides will allow you to build a super clean deck that’s easily shared. Past a certain level of company maturity, however, Google Slides may not be a strong option due to its lack of customization on the design side – it’s much harder to demonstrate the product and brand design in Google Slides.
PowerPoint
Another good free option, PowerPoint can be used on the web for free by anyone with a Microsoft account. Similar to Google slides, this can be a good simple, clean option for early founders without design resources. The paid version of PowerPoint is a bit more robust and can allow for a more mature, established design (even without design resources). The one main con of using PowerPoint for your pitch deck is that the presentation experience can often be clunky and the shared version isn’t as friendly to access as a Google slides or Keynote for non-Microsoft users.
Canva
For established startups with a clear brand and product aesthetic, Canva can be a great option as it provides more customization and design options than Google Slides and PowerPoint. Even the free version of Canva allows you to access many strong Canva-specific templates for customized pitch decks. Because Canva is a web-hosted platform that can make it challenging to present in some circumstances and doesn’t allow for as smooth off-line presentations, however, Canva is a strong design-centric option that is easy to use for founders and not as technical as Keynote.
Later on, we will dive into the specifics of pitch deck design, but once you select your pitch deck creation tool, you can start exploring templates and popular deck flows that successful startups have used. Here at Visible, we recommend starting with these free pitch deck templates to generate some ideas.
2. Craft Your Message
Knowing your pitch deck will most likely only get 5 minutes or less of review, crafting a clear message that tells the story of your company and a clear business plan including details like financial models and product roadmap is critical. Crafting your message can feel overwhelming knowing the window of review will be so small.
There are many formats and philosophies you can use to craft a strong pitch deck. A popular methodology that many founders follow is Guy Kawasaki’s 10/20/30 rule – 10 slides that are readable in 20 minutes or less (aim for less here!) and use a 30 point font. This is a good structure for framing the flow and digestibility of your content. For the actual content, the message of this 10 slide deck, we suggest thinking about the message in 3 distinct parts: The Company Purpose, Problem, and Solution.
Company Purpose
This is the most important part of your message to keep simple. Articulate, ideally in 1 slide and only 1-2 sentences, why your company exists. The company’s purpose is often well articulated as a mission statement. With the company purpose, you are leading into the problem but not particularly addressing the problem just yet. You are simply sharing why your company exists. A few examples from successful companies on the market:
Twitter: To give everyone the power to create and share ideas and information instantly, without barriers.
PayPal: To build the Web’s most convenient, secure, cost-effective payment solution.
Tesla: To accelerate the advent of sustainable transport by bringing compelling mass-market electric cars to market as soon as possible.
The Company Purpose should articulate in a simple way, why your business exists. Establish a clear, strong mission statement that articulates this and the rest of the deck will be built off of that articulated goal.
Problem
Now that you’ve established the company’s purpose, establish the problem that the company will be solving. This section shows not only the problem that exists, but the opportunity for the company or solution that can solve said problem.
To ensure you are keeping the problem section clear yet powerful, lean on as much data as you can to validate the impact of the problem at hand. If there is a certain number of people or businesses that are impacted by this problem, paint that picture. If there is a cost associated with this problem or money currently being spent in the space the problem exists in, articulate that as well.
According to TechCrunch, 73% of successful pitch decks include a breakdown of the market size and opportunity and 46% address “why now” or why this problem should be addressed at this point in time. Another way to think about articulating the Problem is to think about articulating the scope of the opportunity – ie, if the problem is this big, this is the opportunity that exists to solve it and this is why now is the right time to do so. Similar to the Company Purpose, keep the Problem explanation brief – 2-3 slides is our recommendation for tackling the Problem section.
Solution
The Solution section of your pitch deck should be the most comprehensive. In theory, your solution is your comprehensive offering from your product or service to your marketing and customer success. At the end of the day you want investors to be able to answer, “What is their competitive advantage or “secret” sauce?”
Because of this your solution might fall into a few slides but oftentimes you can still create a specific single solution slide the example below:
Why Now?
Investors are oftentimes incentivized to collect as much data as possible during a raise. You need to give them the information they need to move quickly and invest today. Using market data and your own display why now is the right time for them to invest.
Market Size and Opportunity
Venture capital follows a power law curve. Investors are looking for startups that are poised to dominate a market or take a solid percentage of a massive market. In order to help win over investors, demonstrate that your company can become large enough to create significant returns to their investors (Uber is a great case study in how to properly model your market).
Related Resource: How to Model Total Addressable Market (Template Included)
Product
This is the slide where you introduce your company’s product and how it solves the problem at hand. While investors will certainly have questions about the technical aspects of the product down the line, for the sake of a concise deck try to keep the product slide high level and easy to understand. Make this slide as visual as possible including product screenshots or even a light click-through animation.
Competitive Landscape
A big question for investors if they like the fiscal opportunity of the problem at hand is an understanding of who else is trying to solve this problem. Don’t shy away from highlighting competitors.
Competitors validate that there is an appetite in the market. As you highlight other competitors in the space, be sure to highlight how your product and company are different and better for the problem at hand and also call out where there is missed opportunity in the market that your company can cover (this is especially important in a crowded space like marketing technology).
Business Model
Now that you’ve shown the opportunity in the market and what your solution is to address the problem, it’s important to talk through your plan to take this product to market or how you are currently taking it to market as well as how you plan to acquire customers. Check out our deep look at the Customer Acquisition pitch deck slide to ensure you capture all elements of your business model for investors.
Financials and Metrics
Even if investors like your idea, at the end of the day their choice to invest in your business is a financially motivated one. The Financials and Metrics Slide is a key slide to win over the support of a potential investor. Highlight how much money you have raised to date, your key growth metrics over the lifespan of the business so far, and your plan for the investment round in question. To ensure all key startup metrics are addressed in the Financials Metrics slide, take a look at our overview of key startup metrics.
Related Resource: Important Startup Financials to Win Investors
Team
Use the Team Slide as a final push of confidence that an investment in your business is a good one. Highlight the folks on your executive team and what they bring to the table. For example, highlight the past successful companies they have been a part of and helped build, any relevant industry-specific experience, or any unique skills that they bring to the table that give your company a competitive advantage. The Team slide is also a great way to humanize the company and connect with your potential investors by putting faces to name.
Additional Slides to Consider
If you have room in your deck, consider adding a slide that highlights the product roadmap (especially if this furthers the financial opportunity and “why now” argument for your company). Any existing partnerships that you have in your company that add to the fiscal attractiveness of your business may be worth a slide after you highlight your business Model as well. Finally, if the round you are raising is for a later stage round and you can see an exit trajectory insight, it may be prudent to highlight your exit plan on a slide when you discuss financials and metrics to show a more accurate picture of the type of return your potential investors could see sooner rather than later.
3. Level Up Your Pitch Deck With These Tips
After you’ve spent time designing a well-thought-out and clear pitch deck that articulates the company’s purpose, problem, and solution and have built a version you feel confident in, take the time to consider ways to take your pitch deck to the next level before taking it into the boardroom.
Tailor The Pitch to Your Audience
Personalization goes a long way. Make sure you find simple but powerful ways to tie in your pitch to fit the audience you’re talking to. Prior to making your rounds looking for an investment, do your research on the possible meetings you could have. Organize a list of VCs or investors by tiers based on who you would most like to work with. Additionally, take the time to understand each group’s investing philosophy. Prior to any pitch, make sure to tailor your opening talk track and ask “why now” to fit their specific investment philosophy and showcase why this opportunity would be a great one for their firm specifically. Our Visible Connect network is a great database of VCs that will aid in this process.
Be Transparent, Accurate, and Data-Forward
Don’t leave anything out. If your company has had a period of setbacks or pivots, don’t shy away from highlighting that. Additionally, take out any fluff from your presentation that could be seen as opinion or too high-level and instead back up every point you plan to make with hard data. Show, don’t tell. Numbers are the clearest way to give a transparent, credible view of your business and the opportunity at hand.
Read and Revise (Now Do it Again!)
Remember that you’re going into each meeting asking for thousands if not millions of dollars in support. This is a serious ask and you’d hate for a great opportunity to be jeopardized due to some simple errors. Once you think your pitch deck is in its most perfect state, read and revise it again. Now do it again. Take every possible second you can to look for spelling and grammar errors, design and presentation errors, and ensure it’s as clear as possible for any type of investor to process. Practice the pitch to peers and existing partners and employees as many times as possible to get multiple sets of eyes on it for review and revision.
Related resource: Our Guide to Building a Seed Round Pitch Deck: Tips & Templates
4. Follow Pitch Deck Design Best Practices
Once the content is perfect, take the time to ensure the deck design is up to par. A few best practices on Pitch Deck design to consider:
Use a Consistent Visual Style: This will keep the presentation looking clean, easy to follow, and straightforward. Simple is always better so settle on a design theme and format for your slides and stick to it.
Consider Bullet Points: Too many words on a slide can make an investor’s (or anyone’s) eyes glaze over. Minimize the amount of text on each slide by bulleting out the key points. These will be easier for the investors to remember and remove any unnecessary fluff from your deck.
Keep Graphics simple: If you are going to include graphics or visual elements alongside your bulleted text, make sure they are valuable and not elements that are distracting from the purpose of the deck. Keep visual elements simple and make sure they serve a purpose. For example, product screenshots or data graphs are a good way to present information in a different but still valuable way.
For more pitch deck design best practices, check out YCombinator’s guide on best practices from the thousands of pitches they see every year.
Related Resource: Pitch Deck Designs That Will Win Your Investors Over
5. Prepare to Deliver Your Pitch
Even the most perfect pitch deck won’t stand a chance without the right delivery. Practice makes perfect so ensure you have a clear plan in place and spend the time preparing to deliver your pitch. Determine who on the team is best to present. Pitches can be done by one leader with the strongest presentation skills or divided up across the team. The perks of multiple folks presenting ensure that there is coverage on different elements of the business and provide a good natural change to keep interested throughout the pitch. Regardless of who decides to pitch, make sure they are mock pitching and rehearsing as many times as possible. Get feedback from existing investors, partners, or peers and practice daily.
In addition to preparing to deliver your pitch in person, make sure the way you are going to digitally deliver your pitch is glitch-free, clean, and easy to digest. Check out our template for sharing your pitch deck with potential investors here.
Additionally, Visible can be a helpful platform for managing all elements of the fundraising pitch deck process. Use Visible to track and manage potential investor relationships and report out to existing and future investors as your business grows. Learn more here.
6. Share Your Pitch Deck with Visible
Just as a sales team has dedicated tools for their day-to-day, founders need dedicated tools for managing the most expensive asset they have, equity. Our community can now find investors, track a fundraise, and share a pitch deck directly from Visible and completely integrated.
Want to see a Deck hosted on Visible in action? Take a look here. Manage your fundraise from deck to check with Visible. Give it a try here.
Related resource: Business Plan vs Pitch Deck: The Differences and When You Need Them
founders
Metrics and data
How to Define & Calculate ARR for Startups (with Formulas)
Introduction
ARR, or Annual Recurring Revenue, is a key metric for SaaS startups to understand and track. At a high level, ARR is the annual revenue a startup can expect to make. Zooming in, there are a few more layers that define what ARR really is. Understanding ARR and how to calculate it is critical as you build a successful SaaS startup.
Related Resource: Our Ultimate Guide to SaaS Metrics
What is ARR (Annual Recurring Revenue) for a Startup?
For a startup, ARR, or Annual Recurring Revenue is the profit that they can expect to make in any fiscal year period. However, there are a few requirements that need to be considered for a profit number to truly be ARR. For starters, the revenue model for the startup should be subscription-based, meaning that the product sold is not a one-time purchase but rather a recurring cost.
This subscription should be an annual one but can be fulfilled via a variety of billing structures such as monthly billing, bi-annually, or annual payments. The cost of the subscription should be in a dollar amount and always converted into an annual amount. One-off transactions for your products do not count towards ARR.
For a startup, ARR is so important because it contributes to their overall valuation. Investors, no matter what stage of startup you are at, will expect founders to know, understand, and track their startup’s ARR. Additionally, because it’s only a number made up of annualized subscription-based profit, ARR will be a distinct, different number than accountings revenue.
Why do startups like ARR?
Not only is ARR a metric that all investors expect startup founders to know and track, it’s also a favorable metric for founders beyond just pleasing investors. A few reasons why startups like ARR as a metric include:
Forecasting and Growth Planning: Company planning is typically done on an annual basis so when revenue is measured with ARR, it makes company planning that much easier. ARR can help inform not only the annual budget but ARR growth predictions as well. A clear forecast can allow leadership to make smarter, more tactical growth moves around hiring, raising rounds of funding, and eventually, exiting or going public with their business. Related Resource: Building A Startup Financial Model That Works
Customer Payments: With annual subscriptions, customers are only responsible for a single bill every year. This makes the headache of billing, potential delays in customers’ paying, and chasing down revenue that much easier. When the bill is 1x a year for each customer, it’s a huge time saver and allows for more on-time payments by customers and more predictable work for the finance teams at startups. Related Resource: Customer Acquisition Cost (CAC): A Critical Metrics for Founders
Standardized Subscription Terms: Naturally, with software sales, there may be some negotiations around term length for various customers. Most companies have a standard term they prefer (2 years, 18 months, 12 months). With ARR, regardless of term length, each customer’s payments are standardized to one year. This means that payments will always be billed in 12-month increments so all customers produce annual revenue for the business and all billing and contracts are treated the same. Startups love this again for the simplicity for finance teams but also for predictability of growth.
Why do investors like ARR?
As noted earlier, investors value ARR as a key metric when evaluating startups and their founders as potential investments. A few reasons why investors like ARR as a metric are:
Revenue Predictability: This is a big factor for investors to feel confident about an investment. If a product comes with a monthly commitment instead of yearly or a business operates solely on 1-time purchases, this can be a red flag for investors in the business-to-business space. With annualized revenue, there is no risk for seasonality to a product or slow months where monthly or 1-time revenue can not be relied on. With ARR, investors can be ensured that there is clear profitability on an annual basis which provides more security for their investment.
Competitive Landscape Insight: In competitive spaces, investors want to align themselves with the company and product that will ultimately come out on top. It can be hard for investors to evaluate the true best investment in a crowded space where all companies are growing their customer base and employee base and seemingly showing positive growth every year. ARR can help investors understand who the true rocket ships are in a space by understanding the annual revenue growth over time. A dip in ARR year over year can be a red flag but growing ARR even when bringing on new investors that change valuations are a huge positive for investors in evaluating a competitive space. Related Resource: How to Model Total Addressable Market (Template Included)
Ease of Business Valuation: At the end of the day, a steady increase in recurring revenue reassures investors that they will most likely see a return on an investment in your business. ARR is critical because just as it allows founders to plan for the predictable growth for their business, it allows investors to more easily and accurately predict what the value of a business will be based on its ARR growth in 5, 10, 20 years post their investment. A multiple of ARR is a clear way for investors to predict an accurate valuation of a startup’s business and make smart investment decisions.
Related Resource: The Understandable Guide to Startup Funding Stages
How to Calculate ARR
Knowing ARR is the annual recurring revenue for your business over a 12 month period, it may seem like a straightforward metric to calculate. That’s not necessarily the case. ARR can look differently depending on the company. There is nuance to how it is calculated for every business.
Traditional ARR Calculation
Traditionally ARR is calculated for standard annual contracts where a client commits for a 1-year term. The ARR is the total cost of the recurring product or services (what would be billed again after 1 year if the customer chooses to subscribe for another year of product). So if your product is $10,000 dollars annually but you also charge a $3,000 onboarding fee. The ARR on that customer deal would just be $10,000. The 3k is not included as it is not recurring and is only a 1-time fee.
Multi-Year Contract ARR Calculation
If you have a customer that opts in upfront for a multi-year contract, meaning they won’t be up for renewal or re-subscription until that first multi-year contract is complete, this gets factored into the ARR calculation.
Sticking with our example, the recurring fee of your product is 10k a year. If a customer signs up for a 3-year contract, the ARR is found out by multiplying the annual cost by the number of years (10k x 3) and then dividing that total by the number of years (30k / 3) leaving the ARR at $10,000.
This only gets tricky when the contract is not a straightforward multi-year contract but rather a contract length with a number of months that doesn’t quite add up to exact years. If your client has signed up for an 18-month term at 10k a year. The total cost of the product will be multiplied by the result of 12 divided by 18. $15,000 x (12/18) =$10,000 ARR. For a 15 month contract it would read: $12,500 x (12/15) = $10,000 ARR and so on.
MRR Based ARR Calculation
Monthly Recurring Revenue or MRR is income a business can count on receiving every single month. Similar to ARR, it is on a recurring basis however the outcome is a 30 day period vs. an annual period. In some cases, MRR can be used as a basis for ARR calculation.
If your company operates a subscription business where the standard term is monthly (maybe with an upfront commitment of 6 months for example) your MRR can be used to estimate ARR for forecasting purposes. Simply take your total MRR (found the same way you would find traditional MRR, just looking at it month over month) and multiply by 12. So if a customer is paying for a product that is $100 a month, the ARR on that contract would be $100 x 12 = $1,200 ARR.
Common Mistakes Calculating ARR
While overall ARR might seem like a pretty straightforward metric to calculate, many startup leaders make a few common mistakes early on when pulling together ARR calculations. A few of the most common mistakes seen when calculating ARR include:
Including Free Trials
Time granted to a customer to use a product for free or at a temporary trial-period discount, regardless of how long, should not be included in ARR calculations. These should be treated as one-off payments. When the trial converts to an annual subscription, that cost can be used to calculate ARR but only if it is converted to a recurring subscription.
Not Factoring in Discounts
Often, discounts are offered for a portion of a contract to incentive partnership, however, discounts can affect your final ARR. If a customer has a discount for their first year or for any duration of their contract, it needs to be reflected in the ARR. So if the discount is 25% off for the first year bringing a cost down to $750 from a 1k list price, that needs to be reflected in the ARR and $750 should be used as the calculating number. If the discount is only for a set year, upon renewal, the full price can be used for ARR but not before then.
Treating Late Payments like Churn
If a customer is late on a payment, they haven’t churned so their contract should still be included towards ARR. The only difference the company might see here is when the payment hits the bank account but the commitment to a yearly contract is still in place so deals with late payments should be included in ARR calculations.
Other common nuances that should be included in ARR calculations include lost payments from churned customers, upsells on current customer subscriptions, downgraded subscriptions. Common nuances that should not be included in ARR calculations include set-up fees, account adjustments, or any other non-recurring charge.
Track ARR and other KPIs with Visible
ARR is a crucial metric for any successful startup founder and team to master. Calculating ARR can help founders and executives plan for growth, make accurate forecasts, showcase more predictable revenue for investors, standardize their subscription terms, and increase the valuation of their business.
An accurate calculation of ARR can be tricky but is a critical skill to learn. Visible can help founders and investors alike keep track of ARR and a handful of other metrics in a clean, painless, and delightful way. Check out how Visible helps with metric tracking for SaaS businesses here.
Unlock Your Investor Relationships. Try Visible for Free for 14 Days.
Start Your Free Trial