Blog
Metrics and data
Resources related to metrics and KPI's for startups and VC's.
All
Fundraising Metrics and data Product Updates Operations Hiring & Talent Reporting Customer Stories

founders
Metrics and data
[Webinar Recording] A Deep Dive of OpenView’s 2023 SaaS Benchmarks Survey
OpenView Ventures is back with its annual SaaS Benchmarks Survey & Report. Kyle Poyar of OpenView Ventures joined us to breakdown the report and what it means for founders. Check out the recording below:
Webinar Overview
Kyle Poyar of OpenView Ventures joined us on November 9th to take a deeper look at the 2023 OpenView Ventures SaaS Benchmark Survey with Kyle Poyar. Kyle is an Operating Partner where he helps portfolio companies fuel growth and become market leaders. He specializes in monetization, product-led growth (PLG), and SaaS metrics. A few topics you can expect us to hit on:
SaaS Pricing Models
Churn benchmarks
AI adoption
Financial performance

founders
Metrics and data
Market Penetration Strategy 101: How to Calculate & Best Strategies
Market penetration can elevate a business to new levels by tapping into existing products in current markets. This article will delve into what market penetration is, how it’s calculated, and the optimal strategies to achieve it. Whether you’re a startup or an established enterprise, understanding market penetration can help enhance market share and drive success.
What is Market Penetration?
Market penetration is a business growth strategy where companies aim to increase their market share of existing products or services in existing markets. Market penetration is crucial for businesses looking to solidify their presence in an industry and build a robust customer base.
This is done by selling more products or services to current customers or by finding new customers within existing markets. It can be achieved through various tactics like pricing strategies, advertising, sales promotions, and product improvements or innovations. The primary goal of this strategy is to increase market share, revenue, and customer loyalty within a market where the products or services are already available.
The degree of market penetration can be an indicator of the brand’s popularity, business growth, and the level of risk involved. It’s crucial for evaluating the success of products and services in the market and is also a critical factor in developing effective marketing strategies and plans.
Images source
How is Market Penetration Calculated?
Market Penetration is calculated to understand the existing sales or market share of a company in comparison to the total market potential. It provides insights into how much of the potential market a company has been able to capture.
Formula for Market Penetration Rate
Actual Market Size is the current market share or sales volume of the company.
Total Addressable Market (TAM) represents the total sales revenue opportunity available for all companies in a particular market.
Example:
Let’s say a company sells 500 units annually in a market where 10,000 units are sold in total by all competitors. The Market Penetration Rate would be:
This calculation implies that the company has captured 5% of the total market.
Additional resources:
Total Addressable Market Template– In order to help calculate your market share and your potential to build a large business, it helps to calculate and understand the total addressable market and sensitivity analysis. Check out our free total addressable market template below
When & How to Calculate Market Share (With Formulas)
Suggest Market Penetration Rate for Startups
Once you’ve calculated the market penetration rate, it’s essential to analyze it in context. A high rate may indicate a strong market presence but may also suggest market saturation, limiting growth. A lower rate can point to significant growth opportunities, but it could also reflect poor market fit or strong competition.
Companies often use market penetration metrics alongside other market analysis tools and industry benchmarks to develop effective market strategies and identify growth opportunities.
For startups, achieving a market penetration rate of 2-3% is often considered commendable, and it can serve as a strong foundation for further expansion and growth.
8 Best Market Penetration Strategies
To achieve greater market penetration, various strategies can be implemented. The selection depends on the business model, industry, and target audience. Below are eight effective market penetration strategies:
1) Dynamic Pricing
Dynamic Pricing can be a powerful tool for companies looking to penetrate existing markets more deeply. It is a strategy where companies adjust the prices of their products or services in real-time, or near real-time, in response to market demands, competitor prices, and other external factors.
This strategy can be pivotal in achieving higher market share in existing markets as it allows businesses to quickly adapt to market conditions and customer behaviors.
By adjusting prices to meet market conditions and consumer expectations, businesses can optimize their sales and profits, attract more customers, and enhance their market share. However, it’s crucial to manage this strategy carefully to maintain customer trust and satisfaction.
How It Works:
Dynamic Pricing leverages advanced technologies and algorithms to analyze multiple factors that influence demand, including seasonality, competitor prices, inventory levels, and consumer behavior. Based on this analysis, prices are adjusted to optimize sales, revenue, or margins.
Pros
Maximizes Revenue: Enables businesses to adjust prices to meet demand, maximizing revenue during high demand and possibly stimulating sales during low demand.
Competitive Advantage: Allows for real-time response to competitors’ pricing strategies, helping companies stay competitive in the market.
Optimizes Inventory: Helps in managing inventory more effectively by increasing prices when stock is low or decreasing prices to move surplus inventory.
Customer Segmentation: Offers the possibility to segment customers and offer different prices based on customer willingness to pay, optimizing revenue and customer satisfaction.
Market Responsiveness: Provides the flexibility to quickly respond to market conditions like changes in demand or supply, ensuring optimal pricing at all times.
Cons
Customer Dissatisfaction: Customers may perceive dynamic pricing as unfair, especially if they find out they paid more for the same product or service than others, potentially leading to loss of trust and customer churn.
Complex Implementation: Requires sophisticated software, algorithms, and expertise to analyze data and adjust prices accurately and effectively, which can be resource-intensive.
Brand Image Risk: Frequent price changes, especially upward revisions, can lead to a negative brand image and accusations of price gouging.
Price Wars: Can lead to destructive price wars with competitors, resulting in decreased profit margins for all market players.
Legal and Ethical Considerations: In some industries and jurisdictions, there may be legal restrictions and ethical considerations around dynamic pricing, and violating these can lead to fines and reputational damage.
2) Adding Distribution Channels
Adding distribution channels refers to the strategy of increasing the number of ways or locations through which customers can access and purchase a company’s products or services.
By making products or services available through a variety of channels, companies can reach a broader audience, adapt to customer purchasing preferences, and ultimately increase sales and market share within existing markets. This strategy requires careful planning and management to ensure consistency in brand image and customer experience across all channels.
Pros
Increased Sales: Access to more customers through varied channels can lead to higher sales and subsequently, increased market share.
Enhanced Market Coverage: More channels mean broader market coverage, enabling the business to reach different customer segments and geographic locations within the existing market.
Customer Convenience: Providing multiple purchasing options caters to diverse customer preferences, potentially improving customer satisfaction and loyalty.
Risk Diversification: Distributing through various channels reduces dependency on one, mitigating risks associated with the underperformance of a single channel.
Brand Visibility: Presence across multiple channels enhances brand visibility and awareness, contributing to brand equity.
Cons
Complex Management: Managing multiple channels can be logistically complex and administratively challenging, requiring additional resources and efforts.
Inconsistent Brand Image: Maintaining a consistent brand image and customer experience across varied channels can be challenging, potentially affecting brand perception.
Channel Conflict: Different channels might compete against each other for the same customers, leading to potential conflicts and affecting relationships with channel partners.
Reduced Profit Margins: Some channels might require price reductions or additional expenditures, such as commissions for third-party sellers, impacting profit margins.
Customer Confusion: Offering products through too many channels, especially with varied pricing or promotional offers, can confuse customers and dilute the brand value.
When adding distribution channels, companies need to strategically assess the potential impact on the brand, customer experience, and overall business operations. Proper integration, management, and consistent monitoring of all channels are crucial to addressing the challenges and reaping the benefits of this strategy. Balancing the added complexity with the potential advantages is key to successful implementation and sustainable growth in market penetration.
3) Geo-Targeting Specific Locations
Geo-targeting specific locations involves tailoring your marketing and sales efforts to target customers in a specific geographical area or region. This technique is often utilized by businesses to focus resources on areas where they are likely to gain the most traction, allowing them to reach and serve customers more effectively and efficiently.
Geo-targeting can be implemented using various tools and platforms like online advertising services, SEO, and social media, which allow businesses to specify the geographic locations they want to target. Additionally, analytics and data analysis can help in identifying the most lucrative regions to focus on.
Pros
Enhanced Personalization: Allows for more personalized and locally relevant marketing campaigns, improving engagement and conversion rates.
Resource Optimization: Focuses resources and efforts on high-potential or high-performing regions, ensuring better utilization and improved ROI.
Improved Customer Experience: Offering localized content, deals, and products caters to regional preferences and needs, leading to higher customer satisfaction and loyalty.
Market Insight: Provides valuable insights into regional market trends, consumer behavior, and preferences, aiding in better decision-making and strategy formulation.
Competitive Edge: Establishing a strong presence in specific locations can provide a competitive advantage, especially in areas with less competition.
Cons
Limited Reach: Focusing on specific locations might limit the overall reach of the business, potentially missing out on opportunities in other regions.
Resource Intensity: Developing localized strategies and content can be resource-intensive and might require significant investment in research and adaptation.
Market Variability: Different regions may exhibit varying demand patterns, requiring constant adjustments and refinements to the targeting strategy.
Cultural Sensitivity: There’s a risk of misunderstanding local cultures and preferences, which might lead to ineffective or even offensive campaigns.
Data Privacy Concerns: The use of location data can raise privacy concerns and regulatory issues, potentially leading to legal challenges and reputational damage.
4) Continuous Improvements of Products
Continuous improvements of products refer to the ongoing effort to refine and enhance products based on customer feedback, market demands, technological advancements, or competitive dynamics. This strategy is crucial in market penetration as it helps in maintaining and enhancing the appeal of the products, addressing evolving customer needs, and staying competitive in the market.
Pros
Increased Customer Satisfaction: Addressing customer needs and resolving issues lead to higher satisfaction and loyalty.
Enhanced Market Position: Ongoing improvements help in maintaining a competitive edge and solidifying market presence.
Revenue Growth: Enhanced features and quality can justify higher pricing, leading to increased revenue.
Brand Strengthening: Demonstrating commitment to excellence and innovation enhances brand reputation and equity.
Cons
High Costs: Constant refinement and development can be resource-intensive and costly.
Overcomplication: Adding too many features or making too many changes can complicate the product, potentially alienating users.
Customer Overwhelm: Frequent changes and updates can overwhelm and frustrate customers, especially if they are not well-communicated.
Market Misalignment: Without proper market research, improvements may not align with actual customer needs, leading to wasted resources and missed opportunities.
5) Launch a New Product or Rebrand
Launching a new product or rebranding refers to the introduction of a novel product or a significant transformation of existing brand elements, respectively, to appeal to the current market. This can be a pivotal market penetration strategy, aiming to renew consumer interest and address evolving market demands, preferences, and competition.
Pros
Increased Market Share: New or revitalized offerings can attract a wider audience and capture additional market segments.
Enhanced Brand Image: A successful rebrand can modernize and elevate the brand’s image, improving perceptions and attractiveness.
Revenue Growth: New products and improved brand image can drive sales and potentially allow for premium pricing.
Adaptation to Market Changes: Enables the business to stay relevant and responsive to evolving market trends, demands, and consumer expectations.
Cons
High Risk and Uncertainty: The success of a new product or a rebrand is not guaranteed and may not resonate with consumers, leading to financial losses.
Substantial Investment: Development, launch, and rebranding processes can be costly, involving substantial investment in research, marketing, and implementation.
Potential Customer Alienation: Existing customers may react negatively to significant changes in products or brand identity, potentially leading to loss of loyalty.
Implementation Challenges: Executing a rebrand or launching a new product involves logistical, operational, and strategic challenges, requiring meticulous planning and coordination.
6) Build Relationships With Business Partners
Building relationships with business partners involves creating and nurturing mutually beneficial connections with other businesses, suppliers, distributors, or stakeholders in your industry. This strategy is crucial in market penetration as it can open up new avenues for growth, co-development, and expansion, allowing businesses to leverage collective resources, networks, and expertise to enhance market presence.
Pros
Expanded Reach: Access to partners’ networks and resources can significantly extend market reach and presence.
Increased Innovation: Collaborative efforts can lead to innovative solutions and offerings, enhancing competitive advantage.
Cost Efficiency: Sharing resources and responsibilities can lead to reduced operational costs and increased efficiency.
Enhanced Learning: Exposure to partners’ expertise and insights can lead to valuable learning and growth opportunities.
Cons
Potential Conflicts: Divergent goals, values, or management styles can lead to conflicts and strains in partnerships.
Dependence Risks: Reliance on partners can pose risks in case of disagreements, underperformance, or termination of partnerships.
Loss of Control: Collaborations may require concessions and shared decision-making, potentially leading to loss of control over certain aspects of the business.
Resource Diversion: Managing partnerships can be resource-intensive and might divert focus and resources from core activities.
7) Buy a Smaller Competitor in Your Industry
Buying a smaller competitor, also known as acquisition, refers to purchasing another company to control its assets and operations. This market penetration strategy can be powerful, as it allows a company to quickly increase its market share, expand its product or service offerings, and eliminate competition.
When considering acquiring a smaller competitor, thorough due diligence is paramount to assess the compatibility, valuation, and potential synergies accurately. A well-planned integration strategy, clear communication, and cultural alignment are crucial for realizing the full benefits of the acquisition and ensuring smooth transition and consolidation, thus enhancing market penetration and long-term success.
Pros
Rapid Market Expansion: Provides immediate access to new market segments, geographic areas, and customer groups.
Enhanced Resources and Technologies: Acquisition brings in additional resources, technologies, and intellectual properties, enhancing overall capabilities.
Cost and Revenue Synergies: Merging operations can lead to cost savings and additional revenue opportunities, increasing profitability.
Strategic Positioning: Reducing competition and leveraging combined strengths can strengthen market positioning and dominance.
Cons
Integration Challenges: Merging different corporate cultures, systems, and operations can be complex and challenging.
High Costs and Risks: Acquisition involves significant financial investment and carries risks of overvaluation and unanticipated complications.
Potential Culture Clash: Differences in organizational cultures and management styles can lead to conflicts and employee dissatisfaction.
Regulatory Hurdles: Acquisitions may be subject to stringent regulatory scrutiny and approval, potentially impacting the feasibility and timelines.
8) Provide a Rewards Program or Promotional Program
Providing a Rewards or Promotional Program refers to offering incentives like discounts, points, or special offers to customers to encourage loyalty, repeat business, and attract new customers. These programs are instrumental in market penetration as they help in increasing product or service usage among existing customers and drawing in new clientele.
When implementing rewards or promotional programs, it is important to balance the incentives with the overall business strategy and ensure that the programs are sustainable, beneficial, and aligned with brand values. A well-crafted and managed rewards program can be a powerful tool for market penetration, building long-lasting relationships with customers, and creating a competitive advantage in the market.
Pros
Increased Sales: By incentivizing purchases, such programs can drive up sales volumes and revenues.
Customer Data Collection: These programs often involve collecting customer data, which can be analyzed to gain insights into consumer behavior and preferences.
Enhanced Customer Satisfaction: Customers receiving rewards or benefits are likely to be more satisfied and have a positive perception of the brand.
Effective Word-of-Mouth Marketing: Satisfied customers, especially those benefiting from rewards, are more likely to recommend the brand to others.
Cons
Cost Implications: Implementing and maintaining rewards programs can be costly, impacting profit margins.
Customer Expectation Management: Customers may come to expect regular promotions, potentially impacting perceived value and full-price sales.
Complexity in Management: Designing, managing, and optimizing rewards or promotional programs can be complex and resource-intensive.
Risk of Decreased Perceived Value: Regular and extensive promotions can lead to a devaluation of the product or service in the eyes of consumers.
Raise Funds and Penetrate Your Market With Visible
Market penetration is a pivotal strategy for businesses aiming to enhance their market share in existing markets with existing or innovative products. Whether it’s through employing dynamic pricing, adding distribution channels, geo-targeting, continually improving products, launching new products or rebranding, forging business partnerships, acquiring smaller competitors, or providing compelling rewards or promotional programs, each strategy carries its unique set of advantages and challenges.
The key is to meticulously analyze and integrate these strategies, aligning them with the overarching business objectives, customer needs, and market dynamics, to drive sustainable growth and success. Leveraging such multifaceted approaches can aid in navigating the competitive landscape, fostering customer loyalty, and achieving a robust market presence, propelling your business to new heights. And, to successfully penetrate the market, raising funds effectively is crucial—discover how Visible can assist in making your fundraising journey seamless and successful.
Related resource: What is Internal Rate of Return (IRR) in Venture Capital

investors
Metrics and data
TVPI for VCs — Definition and Why It Matters
What is TVPI
In simple terms, ‘Total Value to Paid In’, also known as TVPI, communicates how much a VC fund is worth on paper compared to how much money Limited Partners (LPs) have put into the fund.
To calculate TVPI you take the total distributions paid back to the LPs (realized gains) and add it to the residual value of the investments in the fund (unrealized gains) and then divide the value by how much Limited Partners have contributed to a fund.
It’s important to remember that LPs do not contribute all their committed capital to a fund all at once but rather over time it is ‘called’ by the General Partner for specific reasons such as a new investment.
Related Resource: Fund Performance Metrics 101 (and why they matter to LPs)
Why does TVPI matter in VC
TVPI is one of the earliest indicators current and prospective LP’s will use to measure the performance of a VC fund. It’s essentially communicating whether the fund’s performance is heading in the right direction. In other words, it demonstrates whether the value of investments have increased or decreased.
Any TVPI value greater than 1x means that the fund’s value has grown over time.
LPs use TVPI to compare the performance of funds against each other. The greater the TVPI, the greater the increase in the value of the fund.
To better understand TVPI benchmarks check out Pitchbook’s Benchmark Report as of Q4 2022.
Visible empowers investors to visualize, share, and communicate their most important fund metrics in flexible dashboards.
TVPI within the current market context
According to Hustle Fund, TVPI is the metric that investors are currently feeling squeamish about reporting to potential Limited Partners in today’s tough market conditions. The reason TVPI is low for many funds right now is because their portfolio companies are having a hard time fundraising. If portfolio companies are raising priced rounds at all, the increase in company valuations are marginal or even lower than before (when this occurs it’s called a Down Round).
This means investors are not likely to be marking up any of their investments, causing TVPI to remain the same or even decrease with down rounds.
Whether your TVPI has gone up or down in the last quarter, it’s important to maintain transparent communication with LPs in both good times and the bad.
Check out Visible’s LP Update Template Library to inspire better communication with your LPs this quarter.
Using Visible to track and visualize fund metrics
With Visible investors can keep track of over 30+ fund metrics including:
TVPI
RVPI
DPI
IRR
Multiple
And more
Fund metrics can be visualized in Visible's flexible dashboards alongside text, properties, variance charts, and portfolio metric data.
Over 400+ VCs use Visible to streamline their portfolio monitoring and reporting.
investors
Metrics and data
Reporting
Streamlining Portfolio Data Collection and Analysis Across the VC Firm
Many Venture Capital firms struggle to efficiently collect updates from their portfolio companies and turn the data into meaningful insights for their firm and Limited Partners. It’s usually a painful process consisting of messy Google Sheets or Excel file templates being sent to companies. Then, someone at the VC firm is responsible for the painful task of tracking down companies and convincing them to send the metric template back to the investor. The end result is typically an unreliable master sheet that isn’t accessible or easy to digest for the rest of the firm.
Visible has helped over 350+ VC firms streamline the way they collect, analyze, and report on their portfolio and fund performance. Keep reading to learn how.
Streamlining Portfolio Data Collection
To set up a more efficient portfolio data collection process at your firm make sure you:
Don't require companies to manage another login
Visible’s data Requests are delivered directly to your companies’ email inboxes and the secure-linked base form ensures there is no friction in the data-sharing process.
Maintain founder privacy
Visible supports over 3.5k founders on our platform and the consistent feedback we hear is founders do not want their investors to have direct access to their data sources. Founders prefer to have control over what and when their data is shared with investors.
Customize which information you request from companies
Visible allows investors to create any custom metric, qualitative question, yes/no response, multiple choice, and more. This provides investors with the flexibility to use Visible for more than just financial reporting but also impact or diversity reporting and end-of-year audit preparation.
Related resource: Portfolio Monitoring Tips for Venture Capital Investors
Related resource: Which Metrics Should I Collect from My Portfolio Companies
Easy Ways to Analyze VC Portfolio Data
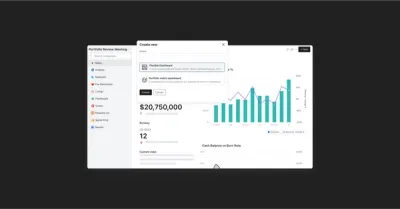
While having up-to-date, accurate investment data is important, being able to extract and communicate insights about your portfolio data is when it really becomes valuable. Visible supports three different types of dashboards to help you analyze your portfolio data more easily.
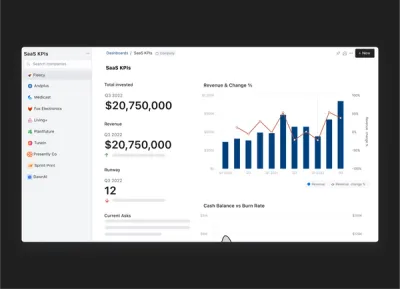
Flexible portfolio company dashboards — Visualize KPI’s by choosing from 9 different chart types and combine with rich text and company properties. These dashboards are a great fit to help facilitate more robust internal portfolio review meetings.
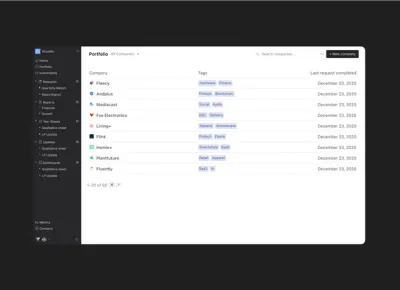
Portfolio metric dashboards — This dashboard allows you to compare performance across your entire portfolio and easily identify your top performers and the companies who may need additional support.
Fund analytics dashboards — This flexible dashboard lets investors control how they want to visualize and analyze their fund performance metrics. Choose from over 30+ fund metrics and auto calculated insights and easily add them to your shareable dashboard.
View an example of all three types of dashboards by downloading the resource below.
Sharing Portfolio Updates with Limited Partners
It’s important to remember that while Limited Partners are primarily focused on financial returns they also care about insights. VC firms who empower their Limited Partners with updates about sector trends and high-level insight into portfolio company performance are setting themselves up to be both trusted and valuable long-term partners to their investors.
LP Update Template Library — Visible makes it easy for firms to make engaging communication with Limited Partners a habit by providing free and open-source Update templates. Want to feature your LP Update template in out library? Get in touch!
Tear Sheets — Tear Sheets or One Pagers can be a great way to provide high-level updates about portfolio companies to your LPs. Visible’s tear sheet template solution helps VC firms create reporting with ease by merging information and data into beautiful charts that are automatically kept up to date.
View Tear Sheet examples to inspire your next reporting.
Related resource: Tear Sheets 101 (and how to build one in Visible)
Visible supports 400+ funds around the world streamline the portfolio data collection, analysis, and reporting process.
investors
Operations
Metrics and data
Portfolio Management: What it is and How to Scale it at Your VC Firm
What is VC Portfolio Management?
Portfolio Management in Venture Capital is a process used by VC investors with the ultimate goal of protecting and increasing the value of their investments. Proper portfolio management is a cumulation of intelligent decision-making, information analysis, and resource commitment all aimed at achieving the value increase and stability in a range of investments.
Portfolio Management within the VC context generally consists of the following:
Market Research and Oversight
Venture capitalists need to be extremely savvy and up-to-date with the most relevant and real-time information about the industries they investment in. Typically, VC firms specialize in a particular type of investment (pre-seed, seed, later stage, etc) and sometimes they are industry specific (B2B Saas, B2C, EnviroTech, FemTech). Therefore, the portfolio that a VC is managing may encompass many different industries. Investors should aim to understand the most up-to-date research on how each industry and market is growing and changing. This helps investors make smart initial investment decisions, inform follow-up funding decisions, and appropriately advise on timely exit strategies.
Risk Profiling
VC investing is a risky business. However, a clear understanding of how long it will take to gain a return on an investment is critical for investors and goes hand in hand with market research when setting up a portfolio management strategy. VCs need to profile the level of risk of each investment with an informed understanding how long it will likely take to get their initial investment back (typically 3-7 years) and how likely they are to 10x their investment. The balance of quick return with high potential is critical to consider when managing new investments in a VC portfolio.
Exit Strategies
As a VC is first making an investment, they typically write into their investment strategy how they hope to exit the business. This plan includes identifying exit targets and appropriate negotiation engagements in best and worst-case scenarios for the business. Strategies might be mergers, acquisitions, buyouts, or public offerings. An ideal exit strategy is important to outline as a part of a portfolio management strategy. This helps investors better mitigate risk and understand the potential outcomes and value of a portfolio.
Related resource: What is Acquihiring? A Comprehensive Guide for Founders
How Exactly Does Portfolio Management Work?
More experienced venture capitalists will use their past experiences to determine patterns in investment strategies and the most effective way to interpret different potential investment outcome scenarios. Ultimately, portfolio management in Venture Capital comes down to understanding the delicate balance of qualitative and quantitative information about the investments in a portfolio.
Portfolio management internally within a VC fund consists of market research and oversight, risk profiling, and formulating numerous potential exit strategies. In order to work through these steps, a VC will need updated information from their portfolio companies on a regular basis. VCs are looking for a mix of metrics and qualitative data from their portfolio.
If you’re a VC looking to streamline the way you collect data from your portfolio companies, check out What Metrics Should I Be Collecting from my Portfolio Companies.
Collecting Portfolio Data in Visible
70% of the 350+ funds using Visible are requesting data from companies on a quarterly basis. Learn more about portfolio monitoring in Visible.
Check out an Example Request in Visible.
Portfolio Management Metrics
Of course, there are metrics that are commonly tracked amongst VC portfolio companies to help VCs stay on top of their portfolio performance. A couple of the key metrics and areas we generally see VCs focused on:
Financials and cash position
A VC wants the honest truth about how their companies are positioned financially. They will want to know metrics such as Cash Balance, Burn Rate, Runway, and Gross Profit. Investors may also ask for the forecast for these metrics. This information helps a VC determine whether they’re likely to reserve cash for a follow-up investment in a company and what a potential exit strategy might be.
Related Resources: Which Metrics Should I Collect from My Portfolio Companies?
True North KPIs
Depending on the type of business a company is operating, their ‘True North’ KPIs will differ. A company’s true north KPIs should be the key performance indicators that are guiding the business every single day. Beyond revenue goals, examples of other KPIs could be active users, a customer net promoter score, active customers, or average contract value. These KPIs will help a VC determine how the company is performing versus sector benchmarks.
Related Resources: Startup Metrics You Need to Monitor
Ownership and Cap Table Data
If a VC is looking to make a new investment, an important component they will consider for their portfolio management is how much ownership they will have in the company. A founder seeking investment should be transparent about what percent of the company is available in exchange for investment (if any) and how much is already taken. In addition to a clear ownership breakdown, a company should share information about its securities (stock options etc..). This information will be extremely relevant as the VC determines how to structure a potential investment deal.
Portfolio Management Qualitative Information
Collecting the metrics and quantitative data is only part of the portfolio management process. We also see investors collect a number of different qualitative fields to help them better understand how a company is performing. A couple of examples below:
Wins from the Previous Period
Founders shouldn’t be shy. Companies should be sure to highlight their most recent, and impressive wins as a company. This will energize and excite a VC who is determining which of their current companies they may want to make a follow-on investment into. Investors will also likely use this information when deciding whether to introduce a company to a potential follow-on investor. When investors make intros to other investors, they’re putting their social capital on the line. Companies who have instilled confidence in their current investors are more likely to get intros to follow on funders.
The VC Advantage
Venture capitalists take portfolio management so seriously because they of course want to see their portfolio investments succeed and make money. Therefore, outside of putting down the initial investment, venture capitalists usually incorporate many other touchpoints and opportunities to help their investments succeed. Outside of the fiscal advantage VC investments provide, a close relationship with investors and VCs can be a competitive advantage that makes or breaks a company.
Ultimately, VCs want to help their portfolio companies because it helps them. In addition to actively monitoring the metric performance of their portfolio, VCs want to offer assistance in any way that they can to give their investments a competitive advantage. These competitive advantage points are also a part of a successful portfolio management strategy. VCs help their portfolio companies in a variety of ways:
Taking action on metrics – As mentioned above, VCs are continuously monitoring their portfolio investments. VCs analyze their companies’ profits, customer churn, average deal size, and more. An informed VC can provide insights and advice to companies to help them improve their performance metrics. Drawing form experience managing other investments, they will have insight into what works and what to avoid or change in order to succeed.
Hiring decisions – VC partners are often ex-founders who have successfully built and exited one ore more companies. They are experienced in hiring founding teams and can help advise what roles are the most critical to higher first. Additionally, VCs networks are deep and wide. A founder may have the chance to hire a seasoned CFO or CMO through an intro from a VC. Hiring the right people is critical to the success of early stage companies and leaning on a VC partner to do so may allow a founder to access talent that wouldn’t have otherwise been interested in their company. (Relevant resource: 5 Ways to Help Your Portfolio Companies Find Talent)
Fundraising assistance – Fundraising is exhausting but necessary as companies aim to quickly scale their business. After partnering with a VC for an early round, investors want to ensure the right investment partners come onboard for later rounds. If a company is on track to succeed, leaning on existing VC relationships to find additional investors is a smart idea. An existing VC will want to work with other firms or angels they get along with or align with ideologically and will often go above and beyond to help you make new connections and raise a new round of funding. (Relevant resource: How to share your fundraising pipeline with your current investors)
Strategic product decisions – With a close eye on the market, a VC can be a good sounding board for what pivots or iterations to make to a company’s product. It’s easy for founders to get stuck in a silo, only focusing on the details of their product. A VC can provide helpful advice on what decisions to make that better keep in mind the market and competitors, even providing tough love on what product decisions might not be right.
Related Resources: How to Lead a Portfolio Review Meeting for VC’s
How Visible Can Help
Investors of all stages are using Visible to streamline their portfolio monitoring and reporting processes. Visible helps investors streamline the way they collect data from their founders on a regular basis and provides data visualization and reporting tools.
Over 400+ Venture Capital investors are using Visible to streamline their portfolio monitoring and reporting. Learn more.
investors
Metrics and data
Operations
Portfolio Monitoring Tips for Venture Capital Investors
What is Portfolio Monitoring
Portfolio monitoring in the context of Venture Capital is the process of tracking the performance of investments in a venture fund. The primary focus of portfolio monitoring is tracking the financial metrics of a company but it also includes monitoring key operational changes, fluctuations in companies’ valuations, and trends in the respective company’s market or industry.
We recently asked 50+ investors to choose their top three reasons for collecting structured data as a part of their portfolio monitoring processes.
You can find a summary of the results below —
Top three reasons investors take portfolio monitoring seriously:
Investors want to better understand how their companies are performing in general
Investors want to provide better support to companies
Investors need to provide updates to Limited Partners
How to Monitor Venture Capital Portfolio Companies
Investors struggle to monitor their portfolio companies effectively because if they hear from companies at all, it’s in a format that is unstructured and in a frequency that is unpredictable. This makes it extremely difficult for investors to have an accurate data set from which they can draw meaningful insights or share updates with their Limited Partners.
Investors who effectively monitor their portfolio companies have a process in place to collect structured updates from their companies on a regular basis — from day one. In the early days of a fund when there are typically less than 10 companies, this can look like sending an Excel file or Google Sheet template to portfolio companies via email and asking them to complete it and send it back.
It’s important to have a reporting process in place from day one because the more time that passes, the harder it can be to change portfolio company behavior when it comes to reporting.
As a fund’s portfolio grows, this process becomes cumbersome and investors often find they are wasting time chasing companies, trying to keep track of which companies have responded and which haven’t, and collating numerous templates into a master portfolio data file.
Visible helps over 400+ investors streamline the way they collect, analyze, and report on their portfolio data.
What Metrics to Track for VC Portfolio Companies
To monitor the performance of portfolio companies it’s crucial to track the right metrics across all your companies. The most common metrics to track include:
Revenue
Cash Balance
Monthly Net Burn Rate
Runway
Net Income
Headcount
Read more about which metrics to collect from portfolio companies and why.
Based on data from the 400+ funds using Visible, most investors are asking for their companies to report 8 metrics and 1-2 qualitative questions on a quarterly basis.
Learn more about VC Portfolio Data Collection Best Practices in our guide.
VC Portfolio Monitoring Template
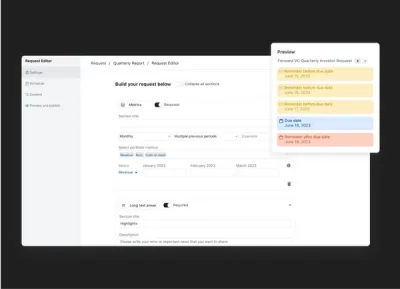
Visible provides investors with a streamlined, founder-friendly way to collect structured data from portfolio companies on a regular basis. The solution in Visible that empowers investors to easily collect KPIs is called a Request.
Visible allows investors to build custom data Requests that support:
Automated email reminders to reduce chasing companies
Assigning custom metrics to certain companies
Sending a Request to multiple points of contact
Asking for budget vs actuals
Secure linked-based forms for companies
Portfolio companies reporting in multiple currencies
Check out an Example Request in Visible.
Portfolio Monitoring Tips for Venture Capital Investors
Set expectations early on.
Consider outlining your reporting requirements in a side letter
Have a process in place to collect data from day one — it’s harder to change reporting behavior change later on
Incorporate reporting expectations into your onboarding process
Check out this Guide to Onboarding New Companies into Your VC Portfolio.
Communicate the why to portfolio companies.
Explain how responses will help inform portfolio support
Explain which data will be shared with LPs and which is just for internal processing
Explain how it will be used to inform follow on investment decisions
Make your data Requests founder-friendly.
Don’t ask for more than 5-8 metrics
Use metric definitions to reduce back-and-forth
Send your Request at the same time every period
Make sure you have the right points of contact at the company
Don’t make your companies create an account if they don’t want to
Turning Your Portfolio Data into Meaningful Insights
After going through the effort to collect structured data from portfolio companies the next important step is turning into important insights that can be shared with your team and eventually your Limited Partners.
Visible has a suite of tools to help with portfolio data analysis including
Robust, flexible dashboards that can be used for Internal Portfolio Review meetings
Portfolio metric dashboards to help with cross-portfolio insights
Tools to slice and dice your portfolio data by custom segments
Over 400+ Venture Capital investors are using Visible to streamline their portfolio monitoring and reporting.

investors
Metrics and data
Customer Stories
Case Study: How The Artemis Fund Uses Visible to Create Annual Impact Reports
About The Artemis Fund
The Artemis Fund is on a mission to diversify the face of wealth. Founded in 2019 in Houston Texas, the firm is led by General Partners Diana Murakhovskaya, Leslie Goldman, and Stephanie Campbell. Their team of five invests at the seed stage and leverages their conviction that the future of financial services and commerce will be written by diverse entrepreneurs. The Artemis Fund has invested in 20 disruptive fintech, e-commerce tech, and care-tech companies founded and led by women.
The Artemis Fund joined Visible in April 2021 with the primary objective of streamlining the way they collect both core financial metrics and impact metrics from their growing portfolio. For two years in a row now, The Artemis Fund has turned their metrics into a data-driven impact report using Visible’s portfolio monitoring tools.
Unexpected Benefits of Creating Impact Reports
Juliette Richert from The Artemis Fund shared the objective of their impact reports has broadened over time — reaping more benefits than they originally intended.
Impact is integral to The Artemis Fund’s investment thesis so there was always a desire to measure their impact; however, the primary objective of publishing their first impact report in 2021 was for fundraising from future LPs. Needing data to back up the narrative of your portfolio’s performance to LP’s is something we commonly hear from investors using Visible.
Over time, the team at Artemis realized the companies they were investing in were having an outsized impact on the communities they are serving. Juliette shared their “portfolio companies are very focused on their end users.” The Artemis team worked with their founders to identify which impact metrics are most integral to their businesses and then Artemis began tracking them using Visible’s portfolio monitoring tools. This larger ripple effect is a major driver behind Artemis’ work and so the team was excited to have actual metrics to back up their investment strategy.
The Artemis Fund’s 2022 impact report clearly communciates their thesis and the narrative behind their portfolio companies’ performance, both of which are made more compelling because they’re backed up by data.
This year they distributed their impact report to their wider network. The unexpected result was that it has become a valuable marketing tool for their fund for not just potential investors but it’s helped attract more founders to their deal pipeline as well. Artemis’ report clearly demonstrates that they’re not just paying lip service to investing and supporting female founders — they’re actually executing against their values and have the data to prove it.
“Using Visible streamlines the way we collect and digest metrics, helping us understand the health of our portfolio and address potential issues proactively.”
— Juliette Richert, The Artemis Fund
Choosing Which Impact Metrics to Track
The first step of creating Artemis’ Impact Report was choosing which metrics to track from their portfolio companies and setting up a data Request in Visible.
Check out an Example Portfolio Data Request in Visible.
The Artemis Fund created 35+ custom metrics in Visible, some of which were collected from all companies, and the rest were assigned to specific companies based on the business model or sector.
Headcount Metrics
Artemis collects these metrics from all companies on an annual basis.
FTE Headcount
PTE/Contractor Headcount
Diverse Headcount #
Female Headcount #
Custom Impact Metrics
Artemis assigns these metrics to specific companies in VIsible and collects them on an annual basis. The list below is not comprehensive.
CO2 Saved (Assigned to portfolio company DressX)
Families Served (Assigned to portfolio company Hello Divorce)
Musicians Served (Assigned to portfolio company Green Room)
Financial Metrics
Artemis collects these metrics on a monthly basis from all companies. The list below is not comprehensive.
Cash Burn
Cash Balance
Revenue
Expected Runway
Total Funding
The Artemis Fund Collected Annual Impact Metrics with a 94% Response Rate Using Visible
Aggregating Impact Data into a Report
Next, The Artemis Fund aggregated their portfolio data within Visible using the Portfolio Metric Dashboard which provides quick insights such as the total, minimum, maximum, median for any metric.
The portfolio-wide metrics Artemis included in their report are Revenue & Capital for SMBs, Number of Families Served, and Number of Jobs created.
This year, instead of providing an overview of each company they chose to highlight specific companies in the form of a case study in their impact report. The result is a more digestible yet compelling report that certainly helps LPs and founders understand the type of companies Artemis’ chooses to back.
The entire compiled report is 17 slides. The Artemis Fund’s deck is hosted on Visible’s deck feature which allows them to distribute the deck via a shareable link and gives them control over their branding, email gating, password protection and more.
View the full impact report here.
Visible helps 350+ funds streamline the way they collect and analyze portfolio data.

investors
Metrics and data
Venture Capital Metrics You Need to Know
The world of Venture Capital is full of jargon and acronyms that can make the industry seem intimidating. When it comes to Venture Capital metrics, it’s important to have at least a high-level understanding of what they mean so that you can contribute meaningfully to team discussions and evaluate investment performance accurately. This post breaks down common VC investment metrics that you’ll likely come across in venture.
Related resource: The Only Financial Ratios Cheat Sheet You’ll Ever Need
VC Fund Performance Metrics
Multiple on Invested Capital (MOIC): The current value of the fund as it relates to how much has been invested.
Related resource: Multiple on Invested Capital (MOIC): What It Is and How to Calculate It
Distributions per Paid-in-Capital (DPI): The amount of money returned to Limited Partners, relative to how much capital Limited Partners have given the fund.
Residual Value per Paid-in-Capital (RVPI): The ratio of the current value of all remaining (non-exited) investments compared to the total capital contributed by Limited Partners to date.
Gross Total Value to Paid-in-Capital (TVPI): The overall value of the fund relative to the total amount of capital paid into the fund to date.
Internal Rate of Return (IRR): The expected annualized return a fund will generate based on a series of cash flows taking into consideration the time value of money. (Read more about IRR for VC’s)
Visible lets investors track and visualize over 30+ investment metrics in custom dashboards.
You may also like → Venture Capital Metrics 101 (and why they matter to LP’s)
Fund Operations Metrics
Management Fees: A fee commonly paid annually by the fund to cover things like General Partner compensation, insurance, and travel. This is typically 2% of committed capital.
Escrow: Capital temporarily held by a third party until a particular condition has been met. Typically occurs as a part of paying distributions to Limited Partners.
Expenses: Money used to complete investments by the fund, such as legal costs, and other ongoing operational expenses of the fund, such as an annual audit.
Carried Interest: The amount of money returned to the General Partners of a fund after a liquidity event such as when a portfolio company gets acquired. Carried interest is typically 20% of profits, although it can vary depending on a GP’s track record and management fee.
Distributions: The transfer of cash or securities from a venture capital fund to its investors, called Limited Partners, after the fund exits its position in one of the companies. Typically 80% of distributions are returned to LPs. The timing of fund distributions varies from fund to fund.
You may also like → Venture Capital Fee Economics
Valuation Metrics
Fair Market Value (FMV): The value of an investment at a certain point in time. The most common trigger for a change in the FMV is when there is a company raises a subsequent priced round and a new company valuation is established.
Realized FMV: The value of an investment that has actually been realized through a liquidity event such as an acquisition.
Unrealized FMV: The perceived value of an investment that has not yet been realized through a liquidity event.
You may also like → 25 Limited Partners Backing Venture Capital Funds + What They Look For
Capital Metrics
Total Invested: The total amount of capital invested in portfolio companies. This includes initial capital and follow-on capital.
Committed Capital: The amount of money a Limited Partner promises to a venture capital fund.
Capital Called: The capital called from Limited Partners. Typically capital is called on an as needed basis before making a new investment.
Capital Remaining: Capital remaining in a fund that is yet to be invested into companies. Also referred to as ‘dry powder’ and unspent cash.
Uncalled Capital: Capital that has been committed by Limited Partners but not yet called by the fund.
Track & Visualize Your Fund Metrics in Visible
Visible lets investors track and visualize over 30+ investment metrics in custom dashboards.
Additional VC Metrics Supported in Visible
Visible auto-calculates common investment calculations so investors can more easily understand and communicate their fund performance.
Total Number of Investments: A sum total of investments made into individual companies.
Average Investment Amount: The average check size for all investments out of a fund.
Total Number of Exits: The number of companies that have exited the portfolio.
% of Fund Deployed: The ratio of capital deployed compared to the total committed fund size.
% of Fund Called: The ratio of capital called compared to the fund size.
Follow On Capital Deployed: The amount of capital deployed into existing companies in the portfolio.
Total Portfolio Company Capital Raised: The total amount a portfolio company has raised.
Follow on Capital Raised: The combined amount all companies in the fund have raised.
Visible supports over 30+ investment metrics and unlimited custom KPI’s for portfolio monitoring.
investors
Reporting
Metrics and data
Flexible Dashboards for Venture Capital Investors (with examples)
As a venture capital investor, it’s critical to maintain accurate, up-to-date information about your portfolio companies and investment data. This helps investors make data-informed investment decisions, provide better portfolio support, fulfill audit requirements with relative ease, and not to mention, impress LPs.
What’s even better than just having your data well-organized and easy to find, is when investors can seamlessly turn that data into meaningful insights that are easy to share with internal team members and stakeholders.
Below we describe three different dashboard types supported in Visible that help investors surface and communicate important updates about their portfolio.
Flexible Dashboards for Internal Portfolio Reviews
Flexible dashboards in Visible allow investors to integrate metric data, investment data, and properties directly into a dashboard. The flexible grid layout means investors have control over how they want to visualize and communicate updates to their team.
Investors commonly use these dashboards to facilitate internal portfolio review meetings which keeps their team up to date and engaged about important updates across the portfolio.
View flexible dashboard examples in the guide below.
Fund Performance Dashboards for Communicating with LPs
Visible allows investors to track, visualize, and share key fund performance metrics. Investors can choose from 14+ different chart types and use custom colors to incorporate their branding into their dashboards.
The fund metrics supported in Visible include:
TVPI
DPI
RVPI
MOIC
IRR
Unrealized and realized FMV
Total Invested
Capital Called
and more.
Learn about the 30+ fund metrics supported in Visible.
Related resource: VC Fund Performance Metrics 101
View a Fund Performance Dashboard example in the guide below.
Portfolio Metric Dashboards for Cross-Portfolio Analysis
As a venture capital portfolio grows, it’s helpful for investors to be able to pull quick insights across all their companies. Visible’s Portfolio Metric Dashboards let investors compare performance across the entire portfolio for a single metric. This view can be filtered by a custom segment and time period. Visible also automatically calculates quick insights such as:
Total
Min
Max
Median
Quartiles
View a Portfolio Metric Dashboard in the guide below.
Visible’s dashboards give investors control over how they want to track and visualize their portfolio KPIs and investment data. Learn more about Visible.

founders
Fundraising
Metrics and data
[Webinar Recording] Using SaaS Metrics to Build Your Fundraising Narrative with Forum Ventures
Webinar Recap
Throughout a fundraise, founders are expected to share the data and financials that fuel their business. Jonah Midanik of Forum Ventures joined us on March 21st to discuss all things SaaS metrics and fundraising.
Watch Recording
A few things you can expect us to cover:
The SaaS metrics every founder should know
What metrics a founder should expect to share with potential investors
What metrics and financials a founder should expect to have prepared for due diligence
How early-stage founders should think about more “advanced” SaaS metrics
About Jonah
Jonah has spent the last twenty years at the intersection of marketing and technology as a serial entrepreneur in Canada. He has experienced several different lenses on the founder’s journey from bootstrapping his own startup, to launching new corporate divisions, and raising 8 figures of venture capital.
At Forum, in supporting hundreds of founders’ growth, Jonah has carved out a niche in the market of teaching founders how to build and deliver pitch decks and which metrics to include to convey traction to raise capital successfully.
investors
Metrics and data
Portfolio Monitoring for Corporate Venture Capital Investors
This article includes insights from a webinar Visible co-hosted with the corporate venture firm JLL Spark Global Ventures and Counter Club, a network of corporate venture capitalists brought together by common challenges and opportunities to share best practices. To learn more about Counter Club and watch the full webinar recording head to Counter Club’s registration page.
Corporate Venture Capital Overview
Corporate Venture Capital (CVC) is the practice of large firms investing in small early-stage startups and offering strategic value. They differ from traditional VC’s because they are not only motivated to make impressive returns for Limited Partners (LPs), but are also focused on protecting their corporate strategy and gaining a competitive advantage.
The Limited Partner for a CVC is usually the singular firm which means the capital source is highly concentrated. The parent corporation is often heavily involved in the day-to-day of a corporate venture. CVC teams are expected to know what’s going on in their portfolio at all times and be ready to share insights and regular reporting with their corporate partner.
What is Portfolio Monitoring?
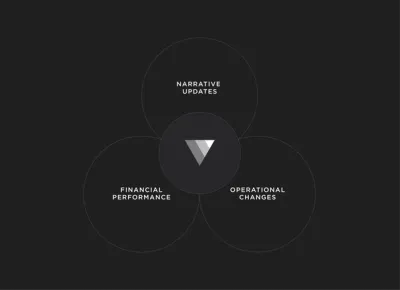
Portfolio Monitoring is taking a holistic approach to understanding what is going on with your portfolio. It can be thought of in three categories: Qualitative Updates, Financial Performance, and Operations Changes.
Narrative Updates: Arguably the most important part is understanding the narrative behind changes going on with certain companies. For example, what’s going right for this company right now and what’s hard right now and why?
Financial Performance: Other aspects of portfolio monitoring is understanding the financial performance of a company and oftentimes comparing that versus what was forecasted. You’ll want to be able to understand the current value of a companies key performance indicators but also extract insights such as quarter-over-quarter and year-over-year growth.
Operational Changes: As a part of portfolio monitoring you’ll want to stay on top of any major operational changes a company undergoes. For example, major changes in total headcount or moving a company’s headquarter to a larger facility could explain the recent change in a company’s burn. Another operational change to monitor is when a company secures additional follow on investment or a change in their cap table.
Learn more about using Visible to monitor your portfolio companies.
Why is Portfolio Monitoring Important within the CVC Context?
Insight into your portfolio companies is critical within the CVC context. By knowing what’s going on with your portfolio companies you’ll be able to provide more impactful, relevant support to your companies. You’ll also be able to gain the confidence of your corporate partner by demonstrating your ability to monitor, manage, and share insights about your portfolio companies.
“Communication is the lifeblood of any relationship. If you’re delivering updates back to the corporate partner and they know exactly what’s going on, you’re more likely to continue to get funding and resources.”
– Mike Preuss, CEO Visible
Benefits of Portfolio Monitoring:
Being able to share meaningful insights with your corporate partner
Using data to drive future investment decisions
Helping portfolio companies succeed
Make introductions to talent, investors, customers
Provide relevant sector-specific expertise
Leverage intraportfolio knowledge to better understand technology trends
Staying organized with a central source of truth
Building more trust with the corporation
“I think what’s really important is having a central source of truth for all of our data whether that be portfolio companies, how much we invested and what was the price, all the information around the deal. Having that in a central location for all the team to look up is really important.”
– Mikey Kailis, Counterpart Ventures, Visible User
Portfolio Monitoring Best Practices
Oftentimes CVCs know they should be monitoring their portfolio companies but don’t know what best practices look like. Here are curated best practices based on Visible’s experience supporting over 400 investors.
Ask for only 5-10 metrics and 1-2 qualitative questions
Staying below 10 metrics reduces the time it takes founders to complete their reporting so they can get back to building their companies.
Most Common Metrics to Track
Revenue
Cash Balance
Monthly Net Burn*
Cash Runway*
Net Income
Total Headcount
*Both of these metrics can be calculated in Visible using formulas and don’t need to be requested.
For more details check out ‘”Which metrics should I be tracking for my portfolio companies”
Use Metric Descriptions
Using metric descriptions helps with data accuracy and can reduce back and forth between you and your companies. Visible’s customer sucess team can help you establish the best descriptions to include with your metrics.
Collect Data Quarterly
According to Visible’s user activity, 70% of investors are requesting updates from their portfolio companies on a regular basis. By establishing a quarterly frequency with your companies you’re getting them into a rhythm of reporting expectations only 4 times a year. It’s also becoming more common to request ESG or DEI information on an annual basis.
For more best practices such as high to get high response rates from companies check out ‘Portfolio Data Collection Tips from Visible’.
Check out an Example Request in Visible.
Providing Strategic Value to Portfolio Companies as a CVC
Corporate VC’s are uniquely positioned to provide strategic value to their portfolio companies. CVC’s are often investing in sectors in which they have deep sector expertise, relevant networks, and commercial experience. All of this can be extremely valuable to companies but only if you know what is going on with your companies and have developed enough rapport for companies to share where they need help.
By incorporating qualitative questions in your portfolio data Request in Visible such as ‘How can we specifically support you this quarter in terms of customer introductions, talent, or market expertise’, CVCs can unlock rich opportunities to deepen relationships with companies and provide strategic value.
The two metrics JLL collects and reports back to corporate JLL to demonstrate strategic value add are ARR and the number of customers.
“Visible helped us develop regular communication with our portfolio companies. It helps us understand where our portfolio companies are focused and how we can best align with them. Our investors also are able to look back at these updates to understand if companies are struggling at the moment and how we need to prioritize our support.” — Kelly Wong, JLL Spark
CVC Portfolio Reporting
You can share updates about your portfolio with your team and wider firm with Visible’s flexible dashboards, tear sheets, and LP Update features. Learn more.
Interested in exploring Visible for your Corporate Venture Capital fund?

founders
Metrics and data
Important Startup Financials to Win Investors
Accounting and finance are skills that every founder should hone. While you don’t need to be an expert, you should be comfortable with different financial statements and be able to answer questions from current and potential investors. Check out our quick breakdown of startup financials below:
What are startup financials?
Startup financials are the vitals behind how a company operates. Financials are the metrics and data that drive the different financial statements for a startup — income statement, balance sheet, cash flow, changes in equity, etc.
As we wrote in our post, Building A Startup Financial Model That Works, “The goal of a financial model is not to be exactly right with every projection. The more important focus is to show that you, as a founding or executive team, have a handle on the things that will directly impact the success or failure of your business and a cogent plan for executing successfully.”
Why are startup financials important for pitch decks?
An investor’s job is to generate returns for their investors (AKA limited partners or LPs). In order to invest in the best companies, investors need to leverage data and their own insights to fund companies they believe have the opportunity to generate returns for their investors.
Related Resource: How To Build a Pitch Deck, Step by Step
Part of this process involves collecting financials and data. Different investors might look for different things when it comes to a company’s financials and metrics — inevitably, an investor will need to take a look under the hood to see how a company operates.
Learn more about the financials that VCs look for in a pitch deck below:
Essential startup financials to include in pitch decks
As we previously mentioned, different investors will look for different metrics and data when it comes to a pitch deck. In order to best help you prepare the metrics and data you need, we laid out the following common metrics that VCs might look for in a pitch deck below (as always, we recommend sharing what you believe is best for your business):
Related Resource: Tips for Creating an Investor Pitch Deck
Gross revenue
Gross revenue is the sum of all money generated by a company. This is important for a pitch deck because investors will want to understand how much revenue a business is generating. For companies that are pre-revenue, make sure you are targeting investors that invest in pre-revenue companies.
Cost of goods sold
As put by the team at Investopedia, “Cost of goods sold (COGS) refers to the direct costs of producing the goods sold by a company. This amount includes the cost of the materials and labor directly used to create the goods. It excludes indirect expenses, such as distribution costs and sales force costs.”
Gross profit
As put by the team at Investopedia, “Gross profit is the profit a company makes after deducting the costs associated with making and selling its products, or the costs associated with providing its services.” This is important because investors want to understand how your business efficiently turns revenue into profit.
Operating expenses
Operating expenses are exactly what they sound like — the expenses a business incurs from normally operating. Operating expenses help investors understand how and where your business is spending money.
Net income
As put by the team at Investopedia, “Net income (NI), also called net earnings, is calculated as sales minus cost of goods sold, selling, general and administrative expenses, operating expenses, depreciation, interest, taxes, and other expenses.” Net income truly reflects the profitability of a company as it takes into account all of the expenses a business will face.
Related Resource: 18 Pitch Deck Examples for Any Startup
Understanding forecasting vs accounting
Over the course of building a startup, founders will inevitably have to understand different basic accounting, forecasting, and budgeting principles. Learn more about forecasting vs. accounting for your startup below:
Related Resource: 7 Essential Business Startup Resources
Financial forecasting
A financial forecast and financial model is a tool that founders can use to tell their startup’s story. As we wrote in our post, Building A Startup Financial Model That Works, “The goal of a financial model is not to be exactly right with every projection. The more important focus is to show that you, as a founding or executive team, have a handle on the things that will directly impact the success or failure of your business and a cogent plan for executing successfully.”
Accounting
Basic accounting is a skill that every founder should be familiar with. Accounting is a realistic look at the financial performance of your business. It’s critical to have a grasp on all elements of your company’s books to ensure your company can grow and scale in an effective way and avoid costly financial errors down the line.
Related Resource: A User-Friendly Guide to Startup Accounting
Financial statements: your startup’s report cards
Having a grasp on your financials is a surefire way to clearly articulate your needs for capital and how you plan to spend any additional funding. Learn more about common financial statements for startups below:
Related Resource: 4 Types of Financial Statements Founders Need to Understand
Income statement
As put by the team at Harvard Business School, “An income statement is one of the most common, and critical, of the financial statements you’re likely to encounter.
Also known as profit and loss (P&L) statements, income statements summarize all income and expenses over a given period, including the cumulative impact of revenue, gain, expense, and loss transactions. Income statements are often shared as quarterly and annual reports, showing financial trends and comparisons over time.”
Balance sheet
As put by the team at ProjectionHub, “A startup balance sheet or projected balance sheet is a financial statement highlighting a business startup’s assets, liabilities, and owner’s equity. In other words, a balance sheet shows what a business owns, the amount that it owes, and the amount that the business owner may claim.”
Statement of cash flows
As put by the team at Accountancy Cloud, “A cash flow statement, or CFS, is a financial statement that accurately summarizes the total amount of cash that goes into and eventually leaves a startup business. Cash flow statements are designed to accurately measure if a startup is managing its cash wisely.”
Impress potential investors with Visible
With our suite of fundraising tools, you can easily find investors, share your pitch deck, and track your fundraising funnel. Learn more about our pitch deck sharing tool and give it a free try here.
Related resource: What is Internal Rate of Return (IRR) in Venture Capital

founders
Metrics and data
How to Calculate the Rule of 40 Using Visible
Since the start of 2022, there have been major macroeconomic changes taking the startup world by storm. Rising inflation, paired with the tumultuous public markets (especially in the technology sector), has made its way downstream to startup fundraising. As the team at OpenView Ventures put it, “For operators, this has led to whiplash from grow at all costs to cut at all costs.”
We partnered with OpenView Ventures for the 2022 SaaS Benchmarks Survey. The main takeaway? Nearly every company is cutting spend, regardless of how much cash they have in the bank.
Valuations are also changing. In 2021, valuations were largely based on growth rates for the next 12 months. However, there has been a transition to public valuations being based on the “Rule of 40.” Put simply, the rule of 40 means a company’s YoY revenue growth % + profit margin % should exceed 40.
As the team at OpenView points out, “For companies with ARR below $10M, Rule of 40 can vary widely from quarter to quarter. Achieving 40 each quarter is not required. But, it is required to have a grasp on what caused a drop or spike, and what can be done to get to 40 long term.”
Learn how you can calculate, and automate, the rule of 40 using Visible below:
1. Track Revenue
First things first, to calculate the rule of 40 you need to know your revenue for multiple years (or periods). You can enter this into Visible manually or using 1 of our integrations (likely Google Sheets, Xero, or QuickBooks).
Once you have your revenue # in Visible, we’ll automatically calculate your growth % (more on this in step 3).
2. Track or Calculate Profit Margin %
Next, you’ll want to make sure you have the necessary metrics in Visible to track your profit margin %. If you are using one of our accounting integrations (like Xero or QBO), or tracking this in a Google Sheet, you’ll be able to automatically bring this in. If you’re starting from scratch, you’ll simply need your revenue and COGs (or Gross Profit).
Once you have your Revenue + COGs metrics in Visible, you’ll be able to calculate it using our formula builder. The formula for Profit Margin % is =
Profit Margin % = ((Revenue – COGs)/Revenue) x 100
Which will look like the following in Visible:
3. Calculate Rule of 40
Now that we have Revenue and our Profit Margin %, we just need to add the two together. We’ll create a new formula shown below (Note: we’ll want to make sure we are using the annual change % insight for Revenue — this is automatically calculated):
4. Chart & Share
Once your formula is set up, it will automatically be calculated as new data enters Visible. From here, you can chart and share your Rule of 40 using Updates and Dashboards — check out an example below:
Track your key metrics, update investors, and raise capital all from one platform. Give Visible a free try for 14 days here.
Related resource: The Only Financial Ratios Cheat Sheet You’ll Ever Need

founders
Hiring & Talent
Metrics and data
Developing a Successful SaaS Sales Strategy
Founders are tasked with hundreds of responsibilities when starting a business. On top of hiring, financing, and building their product, early-stage founders are generally responsible for developing initial strategies — this includes the earliest sales and market strategies.
In this article, we will look to help you craft a successful SaaS sales strategy. We’ll highlight the elements you will want to think of when you start to build your sales motion. This will help your team to understand how to measure the number of potential customers in your pipeline and the growth potential you might see in your revenue numbers.
How are SaaS sales different from other types of sales?
Like any sales strategy, it is important to start with the basics when looking at a SaaS sales strategy. At the top of your funnel, you have marketing leads that likely find your brand via content, word of mouth, paid ads, your own product, etc.
From here, leads are moved through the funnel. In the middle, SaaS companies can leverage email campaigns, events, product demos, etc. to move leads to the bottom of their funnel. However, as the SaaS buying experience takes place fully online — sales and marketing organizations can be creative with their approach. The online experience allows companies to track more robust data than ever before. Additionally, SaaS products have turned into their own growth levers as well — the ability to manipulate pricing and plans has led to the ability for companies to leverage their own product for growth.
Related Resource: How SaaS Companies Can Best Leverage a Product-led Growth Strategy
The online presence and emergence of product-led growth have led to new sales strategies unique to SaaS companies. Learn more below:
3 Popular SaaS sales models
There are countless ways to structure your Saas sales strategy. For the sake of this post, we’ll focus on 3 of the most popular strategies. Learn more about the self-service model, transactional model, and enterprise sales model below:
Related Resource: The SaaS Business Model: How and Why it Works
Self-service model
The self-service model allows prospects to become customers without communicating with your team. As put by the team at ProductLed, “A SaaS self-serve model is exactly what it sounds like. Rather than rely on a dedicated Sales team to prospect, educate, and close sales, you design a system that allows customers to serve themselves. The quality of the product itself does all the selling.” This strategy is typically best for a strong and simple product that typically has a lower contract size.
Transactional sales model
The transactional model allows you to create income-generating actions where prospects have to become a customer at that point in time. This requires transactional sales models to have high-volume sales that can be supported by a strong sales and customer support team.
Enterprise sales model
The enterprise model is a strategy to sell more robust software packages to corporations – you will need baked-in features in a prepackaged manner to sell to a fellow business. Enterprise sales is the model that shares the most similarities with a traditional B2B sales funnel.
Inbound vs outbound sales
In a Saas sales funnel, you are constantly looking to consistently fill your sales funnel with fresh prospects. Once you have prospects you will look to find which prospects are worthy of being qualified and have a high likelihood of converting so you can spend your time communicating with those high-quality prospects.
There are two popular strategies for creating fresh prospects that would be defined as inbound and outbound sales strategies. Inbound sales is when you invest in marketing to create prospects reaching out to you – fresh prospects reaching out to your business to ask about your software product. As put by the team at HubSpot:
“Inbound sales organizations use a sales process that is personalized, helpful, and directly focused on prospects’ pain points throughout their buyer’s journey. During inbound sales, buyers move through three key phases: awareness, consideration, and decision (which we’ll discuss further below). While buyers go through these three phases, sales teams go through four different actions that will help them support qualified leads into becoming opportunities and eventually customers: identify, connect, explore, and advise.”
An inbound strategy typically works best for SaaS companies that need a greater volume of customers and can nurture them and move them through their funnel at scale (e.g. self-service model)
Outbound sales on the other hand are having members of your organization reach out to potential prospects to see if they would be interested in using your service. Outbound sales require highly targeted and proactive pushing of your messaging to customers.
Generally, outbound sales require dedicated team members to manually prospect and reach out to potential customers. This means that outbound sales organizations do not naturally scale as well as an inbound sales organizations and will likely require a higher contract value. An enterprise model would rely heavily on Outbound sales, while a self-service business model will rely heavily on Inbound sales.
The SaaS Sales Process
The best Saas sales strategy will be a hybrid of inbound and outbound sales, but all of them should include a sales funnel. This funnel should have stages that help to qualify your prospects. These stages should be:
Step 1: Lead generation
This activity is often times a marketing activity that gives you contact or business information to explore the fit further
Step 2: Prospecting
This is where you develop the bio of who is the contact you are reaching out to within the organization. It is always helpful to prospect for someone who can make a buying decision
Step 3: Qualifying
In this step, you need to understand whether the prospect has the resources to pay for your product and the problem that your product can solve. This step is often the time for you to ask questions of your prospects
Step 4: Demos and presenting
This is when you will share the features and capabilities of your product with the qualified prospect. You want to show them the different features and where they can get the most value.
Step 5: Closing the deal
After your demo or a presenting call, the prospect should be pushed to a point where they need to make a decision on whether to buy your product.
Step 6: Nurturing
Once someone becomes a customer, you need to make sure to nurture them and grow your product offering with their business. This is the most difficult stage. Make sure to share your new product releases, stay in tune with how they are using your product, and build relationships with your customers.
Cultivating a robust sales team
To create a sustaining sales team, it is important to hire talented and tenacious people to own your sales funnel. They will need to track conversion numbers, stay organized with their outreach to prospects, and grow your funnel over time.
There are three key roles within a Saas sales funnel. Those positions within your organization are:
Sales development representatives
(also known as business development representatives) These members of your team own lead generation, prospecting, and qualifying potential customers on your sales team. They get paid 40-60k/year depending on geographical location and experience. They should be tasked with outreach and drumming up new business.
Account executives
Account executives should focus on giving product demos, closing deals, and nurturing existing customers. They should be a bit more buttoned up in their approach and have a commission incentive associated with the # of accounts they manage.
Sales managers/VPs
Sales managers and Vice presidents of sales should take ownership of the data within your sales pipelines. Numbers like # of new leads, # of new qualified leads, # of new customers, # of churned customers, amount of new revenue, and lead to customer conversion %. Growing these sales numbers each quarter. Measuring these numbers weekly, monthly, and quarterly. Making them visible to the rest of the company regularly.
8 Key Elements of a successful SaaS sales strategy
One of the most important elements of building a successful business is having a like-minded team around you to support and work with you. Make sure to align with all your team members and hire people with good work ethics and similar values of your company. A good sales team should be competitive, goal-oriented, and metric-driven. The sales managers and VPs will be really crucial in shaping the team dynamics and culture of your business. Hire great people and the numbers will take care of themselves!
We’ve identified 8 elements of a successful sales strategy that every Saas sales strategy should include
1. Solidify your value proposition
It is so important to understand thoroughly and communicate your product’s core value proposition. If someone decides to buy your product, they should know how to use the product and how to get the most out of it.
2. Superb communication with prospects
Communication is of the utmost importance. Make sure your prospects understand your product and how it will help their business. Inform them of new product updates
3. Strategic trial periods
An effective strategy is to give potential customers a free trial of your product to understand your value proposition. You want to make sure not to make this trial period too short or too long. Make it strategic so the prospect will understand the value prop but also be encouraged to make a buying decision.
4. Track the right SaaS metrics
Tracking your core metrics is vital to success. See a few of those below:
Customer Acquisition Cost – the amount of money it takes to acquire a new customer
Customer Lifetime Value – the amount of value a customer provides your company over the course of their relationship with you as a customer.
Lead velocity rate – the growth percentage of qualified leads month over month. This will help you understand how quickly you are qualifying your leads
Related Resources: Our Ultimate Guide to SaaS Metrics & How To Calculate and Interpret Your SaaS Magic Number
5. Develop a sales playbook
Every successful sales management team should develop a playbook on how to deploy their resources and where each team member should spend their time. Playbooks are often thought of in sports terms, but they also work wonders in the business world. They will help you do things efficiently and effectively.
6. Set effective sales goals
How many new customers does your business hope to bring in next month? This is an important question and one your whole sales team should understand and work towards!
7. Utilize the right tools to enhance the process
Your team should have all the resources at their disposal to communicate effectively and track their metrics. As you build out your strategy and team, be sure to give them all possible resources at their disposal. There are tons of great tools out there for teams to make the most out of their time and have direct methods of communication with customers and one another.
8. Establish an effective customer support program
A huge part of an effective sales strategy is welcoming potential customers and making sure your existing customers are not forgotten about. When customers reach out, it is important to talk and listen to their issues. Understand what they are needing so your product can continue to evolve.
Make sure anyone getting introduced to your product will also have the information they need to use your product successfully. It might be helpful to include this member of your team in your sales meetings and keep them informed as to messaging and efforts for growth!
Generate support for your startup with Visible
Developing a successful SaaS sales strategy is not an easy task. It will take a hybrid approach of many of the elements listed in this article and will need attentive members of your team to nurture it and test new things. We created Visible to help founders have a better chance for success. Stay in the loop with the best resources to build and scale your startup with our newsletter, the Visible Weekly — subscribe here.
Related resource: Lead Velocity Rate: A Key Metric in the Startup Landscape

investors
Metrics and data
Operations
How to Establish ESG Monitoring and Reporting Practices at Your VC Firm
As we invest in rapidly changing technologies that impact people and the planet, it’s of the utmost importance to consider the unintended consequences—even at the early stage. As the world felt the effects of several major crises in recent times, Environmental, Social, and Governance (ESG) principles have rightfully risen to the spotlight in the venture capital industry and now play a critical role in investment decision-making.
Investors hold a responsibility to guide their portfolio companies in ESG practices, not just because the world is watching—but because companies that are as concerned with their impact as they are with building their products are proven to perform better in the long run.
Visible recently hosted an ESG for Venture Capital webinar with Tracy Barba, Head of ESG at 500 Startups and Director at ESG4VC, where she answered the common questions about establishing ESG reporting practices at VC firms. We’ve shared answers to some of those questions below as well as guidance on using Visible for ESG portfolio monitoring.
What is ESG for Venture Capital?
ESG policies and practices help investors and companies manage their environmental, social, and governance risk and identify opportunities for value creation. VCs—including 500 Startups—are widely embracing the shift. In the 2020 ESG Annual Report spearheaded by Tracy Barba, 500 Startups said their policies include:
Environmental criteria to examine how a company performs as a steward of nature.
Social criteria to consider a company’s relationship with its employees, suppliers, customers, and communities where it operates.
Governance criteria to review a company’s leadership, shareholder rights, executive pay, audits, and internal controls.
VC firms can and should provide an ESG framework as startup companies grow. It’s never too early to care—as we’ve seen in the news, large tech companies have found themselves in legal and ethical trouble over issues that could have been resolved in the earlier stages.
In How Venture Capital Can Join the ESG Revolution, Stanford’s Social Innovation Review pointed out that eventually, ESG should not be understood as an “add-on” but a core value in a VC leading to better investments and companies. Ethical and legal considerations should not be ignored in the service of achieving rapid growth and swift time to market. As a VC firm, there is a risk in your ownership percentage if a portfolio company were to face legal battles, public scrutiny, and other risks that could have been prevented if they were identified earlier.
ESG as a term is often used interchangeably with impact investing. As Tracy Barba points out, impact investing is thinking about the end goal and the impact of the companies you’re investing in. Having a strategy around water or climate is an example of an impact strategy, so you’re filtering deals based on that. ESG is a screening for every company, regardless of the type, measuring their environmental, social, and governance criteria.
It’s hard for an early-stage company to know their impact, such as environmental waste, if they don’t have a product yet. That’s why it’s important to map ESG to relevant stages of a company’s development. At an early stage, the goal is to start to have a conversation. It’s much easier to think about how a company affects the environment from the beginning and address any issues upfront rather than fix or replace already-established processes in the future. At later stages, more detailed discussions will be appropriate.
Founders overwhelmingly do care and want to consider ESG, but many don’t know when or how to get started. As an investor, you can help them start to think through ESG by adding it as an agenda item on your monthly or quarterly check-ins. An example question is: “Are you tracking your carbon footprint?” Their answer might simply be “Yes”, or it might be, “No we aren’t, but we’d like to. How can we get started?”
Why is ESG Becoming More Common in Venture Capital?
There is a growing understanding that ESG policies help with customer loyalty, retaining talent, and attracting more investors. It’s beneficial if a company directs time and energy towards making sure they’re operating responsibly.
In venture capital, some topics are gaining momentum:
Diversity – there are demonstrated benefits to having culturally diverse teams and boards.
Gender equality – supporting more women and as founders and funders.
Data protection & privacy of users – startups are not exempt from laws such as the GDPR and CCPA which protect the personal data privacy of consumers.
Environmental impact trends – caring about carbon emissions, ethical sourcing of materials, waste management, etc.
It’s important to be mindful of regulations and how they can change over time. The Sustainable Finance Disclosure Regulation (SFDR) in Europe aims to prevent greenwashing and to increase transparency around sustainability claims (source: Eurosif). While the SEC currently only recommends ESG disclosure, it may also create firm rules in the future. Companies may start measuring and reporting their ESG progress in preparation for new regulations.
More than ever, founders care about being backed by VCs they align with. VCs can drive a positive shift by integrating ESG into their own operations. Showing that you care as an investor is integral in instilling ESG policies into your portfolio.
How To Monitor ESG Metrics Across your VC Portfolio
You can start tracking ESG metrics across your portfolio by sending them an annual questionnaire. 500 Startups, for example, collects their founder diversity info on a quarterly basis, measuring their progress over time and benchmarking to the VC industry.
Founders already get asked for a lot of information, so to encourage their participation in your ESG questionnaires, ask fewer questions and use simple yes/no answers whenever possible. With Visible, you can fully customize your ESG reporting questions using Requests.
Preview of an ESG Request in Visible below —
View Examples of ESG Monitoring Requests in Visible.
You can track answers and hold founders accountable for how they are going to implement best practices, how they are going to hire, etc.
ESG questionnaires are not meant to penalize startups, but to get a sense of where they currently are—they may only just be starting to think about tracking and monitoring their water usage or diversity, for example. Once they gain customers, the questions you ask them will grow more detailed.
If an early-stage company feels they do not have the resources or bandwidth to manage ESG concerns, you can help them get started by simply putting an employee manual or non-discrimination policy on the agenda for your next check-in. Remember, it’s going to be more expensive if they wait longer to implement those practices.
Tips for ESG Fund Reporting
External consultants can help VC firms evaluate their policies and processes across recruitment, HR, and deal flow, and recommend ways to improve. Since external consultants collect data across venture capital firms, they can educate them about best practices and compare how they are doing relative to the entire industry.
Tracy Barba, Head of ESG at 500 Startups, reported that working with external consultants like Diversity VC was helpful in providing them with an external validation point. This type of industry benchmarking is now growing as a field and becoming more common practice.
Resource: How to increase Diversity at your VC Fund
How to Incorporate ESG Into Your Portfolio Support
Now that you’ve gathered ESG data from your portfolio companies and identified opportunities for improvement, what’s next? VC firms can take the initiative to provide education, tools, training, and resources for their companies—whether in-house or through outside service providers and consultants.
500 Startups provides a vast array of ESG resources for their founders and the public, including webinars, which are available on their website: ESG for Early-Stage.
Resource: Portfolio Support Best Practices for Venture Capital Investors
Tracy Barba’s nonprofit ESG4VC aims to provide education, office hours, and research for venture capital firms to help establish standards and encourage movement in a positive direction across the industry.
It’s been said that we can’t fix what we can’t measure. When it comes to improving the impact business has on the environment, workers, and communities, investors can be proactive in incorporating ESG policies at the very early stages so that everyone can benefit.
View Examples of ESG Monitoring Requests in Visible.
Unlock Your Investor Relationships. Try Visible for Free for 14 Days.
Start Your Free Trial