Blog
Visible Blog
Resources to support ambitious founders and the investors who back them.
All
Fundraising Metrics and data Product Updates Operations Hiring & Talent Reporting Customer Stories

founders
Metrics and data
Building A Startup Financial Model That Works
You’ve heard the stories about companies getting funded based on a sketch on the back of a napkin. If your name is Ev Williams or if that napkin sketch is as compelling as Amazon’s, you may have a shot.
If you aren’t a founder of Twitter, Blogger, and Medium or spend your free time saving journalism and launching rockets, people evaluating your business are far less likely to take your proclamations about the future at face value.
In this blog, we write a lot about the importance of storytelling for a company. No matter who you are talking to – team members, investors, potential investors – company storytelling doesn’t stop, it simply changes contexts and mediums. A financial model is one of those mediums through which your company can tell its story, even without the operational history one might assume would be necessary to persuade investors or make smart decisions about the direction of the business.
Related Resource: How to Create a Startup Funding Proposal: 8 Samples and Templates to Guide You
At Visible, we work with VC backed companies on a daily basis. To get a better understanding of what it takes to build a compelling and useful financial model, we turned to our experience and conversations with customers and laid out our findings below.
Why Startup Financial Models are so Important
When Warren Buffett invests in a company, he makes holistic decisions about the quality of the business as if he is buying the whole thing and not simply a decision about the direction the stock might move.
When building a financial model, a similar philosophy applies. Before breaking the business into discrete pieces and asking yourself which direction each will go, first look at the business as a whole and understand both what you as an organization are trying to accomplish as well as what the intended use of the model and startup financial projections you are building will be.
What do we need to accomplish over the next x months…
…in order to put ourselves into a position to successfully raise a Series A round?
…for this partnership with Big Co. to make an impact on our bottom line?
…so that we can hit profitability and maintain optionality over how we finance our future growth (customers vs. investment)?
…for this product or distribution decision (which puts a significant amount of capital at risk) to pay off?
The goal of a financial model is not to be exactly right with every projection. The more important focus is to show that you, as a founding or executive team, have a handle on the things that will directly impact the success or failure of your business and a cogent plan for executing successfully.
There are a few key reasons why it is an important exercise for startup founders to model and project their future growth:
Fundraising
Different investors will have different opinions on financial projections. Some like to see them to see how a founder is thinking about their business. Others won’t ask for them as most startups likely will miss one way or another. Mark Suster of Upfront Ventures puts it similarly:
“See I don’t care if your projections prove wrong over time. I care about your assumptions going in. I care about the thought that you’ve given to the customer problem. I care about how much you’ve thought about market share, competitors, adoption rates, etc.”
However, projections and financials will become more important later in your lifecycle stage. Where a seed round investor might not necessarily care about forecasts in the early days a Series C investor might want to see more concrete data to model growth.
Related Reading: 6 Types of Investors Startup Founders Need to Know About
Related Reading: A Quick Overview on VC Fund Structure
Related Reading: How to Secure Financing With a Bulletproof Startup Fundraising Strategy
Hiring Plans
Building a financial model is a great way to understand how your overall business performance can impact hiring plans (and vice versa). By modeling different scenarios you can see how adding headcount can impact your bottom line.
Go to Market Strategy
In the earliest days of your business, a financial model and marketing sizing exercise will help you wrap your head around go-to-market strategy. This could be finding a more efficient way to acquire customers or maybe a new playbook for handling churn.
With that being said, financial models and projections can take many shapes and sizes…
Types of Startup Financial Model Structures that Work
Financial projections are essential for any business, even if it’s not yet generating revenue. A variety of specific methods exist for performing this task, but they can generally be classified into top-down and bottom-up approaches. Financial analysts often use both methods as checks upon each other.
Among technology companies – especially ones located in a certain geographic region – the very mention of a financial model evokes thoughts of calculator toting, tie-wearing, number crunchers sitting somewhere in a suburban cubicle.
With the direction sentiment is shifting in the early-stage market, this mindset couldn’t be further from reality. A well-constructed financial model displays a professional approach to running your business and shows that you “take seriously the fact that you are deploying other people’s capital.”
A good financial model consists to two things:
Well thought out projections about the future of the business
A properly structured, understandable, and dynamic spreadsheet
Bottoms Up Startup Financial Projections
A bottoms-up financial model – where you start with 5 – 15 core assumptions about the business – is most useful for a company contemplating a specific product direction, distribution strategy (i.e. invest in paid advertising), or a certain partnership that could potentially have a major impact on the business.
Top Down Startup Financial Projections
A top-down financial model may be most useful for a company that, for example, knows that it will need to go out and raise $X million in a Series A round 15 months from now and has spent time gathering data on what types of revenue, margins, and growth numbers they need to hit to have a successful fundraise. (Note: If you are a SaaS company, the Pacific Crest SaaS Survey is a great starting point to benchmark yourself)
Maybe in this case, those numbers are $1.5MM in MRR with at least 100% YoY growth. With those in mind, you can work backward to understand how much you need to grow and which distribution channels may provide the best bridge from where you are now to where you need to be.
3 Deliverables Included in Every Financial Model
There is not a one size fits all template for financial modeling. The structure of a model for seed-stage SaaS and a Series C eCommerce company will greatly differ. However, there are a few things that should be included in any solid financial statement, regardless of type:
Financials Statements
Every financial model should weigh your different financial statements. While projected financial statements may not be as vital/accurate in the seed stage/early days of a business, they will become more important and accurate in later stages.
Related Resource: Important Startup Financials to Win Investors
Cash Flow Overview
Cash flow overviews are a vital part of a financial model because it will help you understand the true financial health and cash flow of your business. In the seed stage/early days, cash flow is incredibly important to monitor as you are in search of your first customers.
KPI Overview
Using actual metrics and data from your sales & marketing process is important to any financial model. You want to be able to understand how different go-to-market strategies impact your business and give you an idea of where and how you can grow your funnel (and revenue).
5 Metrics Needed for Every Financial Model
As we mentioned above, not every financial model is the same. However, there are a few key metrics that can be translated across most financial models.
Revenue
At the end of the day, revenue is the lifeline of any business. Bringing new revenue in the door is the basis of every model. In a good financial model, you can use other inputs to help you model how your revenue is impacted in different scenarios.
Cost of Goods Sold (COGs)
No matter if it is the cost of goods sold or your expenses at a software company, COGs are a necessary part of any model. You need to understand what it costs to acquire new customers or build a new product.
Operating Expenses
The expenses that go into operating your business are also a necessary part of a financial model. You need to understand how and where your company is spending. Ideally, you’ll be able to model different scenarios with headcount and hiring plans to model how OpEx can impact your overall revenue.
Burn Rate and Cash on Hand
Going hand-in-hand with OpEx are your burn rate and cash metrics. You can use different hiring and OpEx inputs to help model your cash flow. This will be important when weighing different financing options.
Acquisition Metrics
While the name of acquisition metrics will change names from market to market, the idea behind them is consistent. You should include acquisition metrics so you can model how different GTM strategies and plans will impact your overall financial health.
How to Build Your Startup Financial Model
Bottoms Up Startup Financial Projections
The bottom-up approach uses specific parameters to develop a general forecast of a business’s performance. This method might start the number of people you expect to pass by your business each day, also known as footfall. You would then estimate the percentage of footfall that will enter your store and make a purchase. The next step is to estimate the average value of each purchase to project your annual sales. Bottom up projections are based on a set of individual assumptions, allowing you to determine the impact of changing a particular parameter with relative ease.
You may use a bottom-up approach to select a location for a new business. You can obtain an accurate estimate of the footfall by direct observation. You can also observe similar stores in that area to estimate the percentage of footfall that are likely to enter your store. The prices that your competitors charge will give you a good idea of the price you can expect to charge.
Projections
Some investors tend to prefer a bottoms up projection. As we previously wrote, “The reason being that a top-down approach relies on self-reported data from private companies, which can often be misleading, inaccurate or interpreted incorrectly. A bottom-up approach, however, uses firsthand data and knowledge of your own company and reduces the risk of the data being wrong or taken out of context.”
Spreadsheet
For example, assume for this example that an average of 10,000 people pass by a particular location each day. About one percent of this traffic in this area enters a store and makes a purchase, and the average total of each sale is about $5. The expected annual sales revenue in this example is therefore 10,000 x 0.01 x 5 x 365 = $182,500. You can then refine this estimate by considering additional factors such as price changes, closing on weekends and seasonal fluctuations.
Template(s)
At the end of the day, investors view TAM as a picture of how big your business can be. Correctly modeling the market is vital to proving that your business should be venture-backed.
If you need a little help painting a picture of the market your solution could address, try using our TAM template! It has everything you need to start modeling the market your business can capture.
Top Down Startup Financial Projections
A top-down method of estimating future financial performance uses general parameters to develop specific projection numbers. You’ll often use a top-down approach to determine the market share that your new business can expect to receive. You might start with the market value of your product, narrowing it down to a particular location as much as possible. You would then assume that your business will receive a specific portion of that market and use that estimate to generate a sales forecast.
A top-down approach is comparatively easy since the only parameters it really requires is the total market value for your area and the market share you expect to receive. This method is most useful for checking the reasonableness of the projections resulting from a bottom-up approach. However, top down projections aren’t recommended for preparing detailed forecasts.
Projections
Some investors will be weary when pitched using top down projections. However, this does not mean that there is no value in a top down approach. A top down approach is best used for a new endeavor where you may not have proper data yet. For example, if you are a pre-seed company with little to no revenue, it may be best to share your top down projections using outside and general market data.
Spreadsheet
For example, assume for this example you plan to open a business in an area where the total annual sale value of your product is $2 billion. You believe that your business might get 0.01 percent of that market, resulting in annual sales of $200,000. Note that your financial projection is entirely dependent upon the accuracy of your estimate on the product’s market value and your market share. Furthermore, the top-down approach doesn’t ask you “what if” type questions.
Template(s)
At the end of the day, investors view TAM as a picture of how big your business can be. Correctly modeling the market is vital to proving that your business should be venture-backed.
If you need a little help painting a picture of the market your solution could address, try using our TAM template! It has everything you need to start modeling the market your business can capture.
Common Financial Modeling Mistakes
Failing to hit both of the requirements we mentioned in the last section – well-thought-out projections and a well-constructed spreadsheet – will quickly render your model unusable and will reflect poorly on you as a founder and on your company.
Projections
Assuming that revenue will come with scale. While this has long been a criticism of social networks and consumer apps hoping to monetize a critical mass of eyeballs through advertising, many companies who have revenue models built into their businesses from the start (think SaaS or Marketplaces models) still falsely assume that revenue, to the extent they need to be sustainable, will happen once they reach x number of users or “decide to turn on the spigot”.
Focusing too much on point estimates and not range estimates – As Taylor Davidson puts it in a post on his own blog, “instead of agonizing over whether your conversion rate will be 2% or 5%, focus on the possible range or conversion rates and evaluate the results based upon the range of estimates, not the point estimate of 2% or 5%.”
Underestimating Customer Acquisition Costs (CAC) – Just go read this post.
Not doing your homework – There is a tremendous amount of information available, for free, that can help you gauge your performance and benchmark your growth. We mentioned the Pacific Crest Survey above. Other great resources include AngelList, Mattermark, and the blogs of companies embracing the Radical Transparency movement.
Spreadsheet
Spending too much time on non-material data points – The Pareto Principle applies here, just as it does to many other undertakings in a startup. While it might seem like spending time optimizing everything in your model will yield the best results, the reality is that going deep on your 5 – 15 core assumptions will yield a much more effective result.
Failure to design your model for usability – To make your model most effective, you need to pay close attention to how usable the output is for viewers. That means clear explanations, a simple structure, and making sure to follow convention so there are no surprises. We linked to it above but David Teten of ff Venture Capital has a great post on the topic of standardizing the way you build your startup spreadsheets.
Neglecting to include a sensitivity analysis – This goes back to the idea of understanding what your model outputs look like for a range of estimates. You should also keep in mind that your model should be treated as a flexible, living document. That means that your assumptions shouldn’t be hard-coded. Instead, as Taylor recommends, “create your assumptions so that you can easily change an assumption in one place and all formulas and outputs will recalculate automatically.”
Displaying only financial statements and neglecting key metrics – Financial statements go a long way in showcasing the overall health of a business. Unfortunately, many models stop at the financial statements. What investors want to see is a synthesized look at those financials that make it easier to evaluate your business. As an example, a good model won’t just showcase projected revenue growth, it will look at how things like customer growth (and churn) and contract size work together to contribute to that top line number.
Best startup financial model resources
Unless you spent the first couple years of your career cutting your teeth inside an investment bank, your best bet is to lean on existing resources for the structural composition (i.e. the spreadsheet) of your financial model.
The Standard Startup Financial Model that Taylor Davidson has put together on Foresight.is has been used by over 15,000 people across the world – from one-person operations just getting started to companies raising large VC rounds or considering acquisitions.
And while we don’t recommend building your model from scratch, it is useful to understand how one can construct a professional financial model. Here are a couple quick resources, recommended by Davidson and us here at Visible:
Best Practices in Spreadsheet Design by David Teten of ff Venture Capital
3 Traits of a Great Financial Model from Mark MacLeod
Finally, if you are looking for a less sophisticated model or something to fit a specific modeling use case (user acquisition, revenue growth, or operations) here is a quick list of resources recommended by Davidson:
Revelry Labs resourcing spreadsheet for operations modeling
OpEx Budgeting from IA Ventures
Viral Marketing modeling from Andrew Chen
Modeling SaaS Customer Churn, MRR, and Cohorts from Christoph Janz
Related Resource: A User-Friendly Guide to Startup Accounting
Putting Your Financial Model to Work
Mark Suster offers great advice for taking the financial model you have built and using it to help grow your business:
“Financial models are the Lingua Franca of investors. But they should also be the map and the Lingua Franca of your management discussions.”
Financial models play a key role in all of the major discussions you have about your business with all of your key stakeholders. A comprehensive financial model will have within it a number of different pieces that are relevant to different conversations within your company.
The interplay between your revenue growth, your current burn rate, and the amount of money you have in the bank are all useful when putting together a hiring plan. Your assumptions for revenue can be isolated and used as a jumping off point when discussing a change to your distribution strategy. And as mentioned above, the projections you build around your key performance metrics are a crucial part of a successful fundraising process.
In some cases – whether internally with management or externally with investors – the conversation will be high level and in other instances you will need to be more granular. If you have taken the time to thoughtfully prepare your assumptions around the future of your business, your most critical conversations will be more productive and you give yourself a strong advantage in the daily battle for capital and talent.

founders
Metrics and data
a16z Startup Metrics Template
Andreessen Horowitz Startup Metrics Template
Andreessen Horowitz (a16z) is one of the most prolific VC investors in the market today. With investments across a number of different stages, sectors, and business models, they have seen first hand the lack of (and the need for) standardization in the way private technology companies track metrics and present those metrics to current and potential stakeholders.
While their well known post, called “16 Startup Metrics“, dives deep into a number of great metrics for different business models – Marketplaces and Ecommerce in particular – we focused this video on SaaS metrics and how companies can use Visible templates along with other sources to benchmark themselves against others in the market and set themselves up for fundraising success.
For benchmarking purposes, we leaned on this year’s Pacific Crest SaaS Survey. With over 300 respondents representing different geographies and sizes, the survey provides very actionable insight into how your company is performing relative to others in the market.
Pacific Crest Respondents
SaaS Revenue and Profitability Metrics
In our example, we are looking at a SaaS company with Total Annual Revenue of just under $2 million (we’ll call them ExCo.). At this size, it it likely they would be going out to raise a Series A round of funding.
MRR vs. Service Revenue
There are generally two types of revenue for a SaaS company – the first is Subscription Revenue (called MRR or ARR). This is product focused revenue that is recurring and predictable — especially if you are able to sign customers to longer term agreements. Investors prefer this type of revenue because it signals a high quality product with a path to long-term profitability.
The second type of revenue is Services Revenue which often comes in the form on one-off (read: not predictable) consulting engagements or implementation fees. Because of the human-capital intensive nature of providing these services, they are far less profitable and scalable than Subscription Revenue.
According to the Pacific Crest SaaS Survey, the median gross margin on subscription revenue is almost 80% while the margin on professional services in under 20%
Average Contract Value (ACV)
As defined in the a16z post, ACV is “the value of the contract over a 12-month period.” If you are seeing an uptrend in ACV over time (which is generally the goal), then your company is likely doing one or many of the following things:
Shifting to customers with a larger budget – more seats, usage, etc.
Employing a more effective sales strategy to convince customers to invest more heavily in your product
Building a product that continues to improve and provide increasing value
Effectively upselling existing customers
SaaS Gross Profit Margin
Growing the top line is necessary to build a scalable business but in order to build a sustainable company – or raise capital that helps get you to that point – your profitability (in this case, we are looking at Gross Margin) must be trending in the right direction.
Here, we see Gross Margin increase initially and then fall off in recent periods. This could result from a number of factors:
Churn from high margin customers
Pricing pressure from new entrants or large players
Lower percentage of revenue coming from MRR (subscription revenue)
An increase in the infrastructure required to deliver the product (server costs, support costs, etc.)
In the case of ExCo. we know that ACV is moving up and that the revenue stream is becoming more and more weighted towards subscription revenue so we can rule out a couple of potential causes. What is likely occurring is an increase in the infrastructure required to deliver the product (server costs, support costs, etc.). When the numbers change, it is crucial to know why and to be able to present context and a path forward when discussing those changes with investors.
In spite of the dip, ExCo.’s gross margin still remains in the same ballpark relative to others in the market and is higher than it was the previous year.
As your company moves further and further through the Venture fundraising lifecycle – from Seed to A to Growth rounds – the numbers gain importance in the overall story for the fundraise. The metrics above provide a quick glimpse of high level figures that can be very useful in getting in a foot in the door with some investors — strong MRR growth, a robust Sales Pipeline, growth in the commitment of future revenue (known as Bookings), and low Churn Rate (among many other factors) can also play a significant role in the success of your fundraise and in the long term viability of the business.

founders
Reporting
The World’s First Unicorn
In 2015, 78 New York Times articles have included the word “Unicorn”. That ties this year with 2014 for the word’s highest number of mentions and with investors and pundits surely clamoring to puff up or tear down a couple more companies before the holiday break, odds are good that we’ll see a few more mentions in the (web)pages of the “Gray Lady”.
1901, as evidenced in the chart above, was a far less enlightened time than we live in today. For starters, “Unicorn” made it to print a mere 5 times during the course of the year.
And while transatlantic experimental radio communications were made for the first time, we were years away from Radio on the Internet. Although Satori Kato filed a patent for the first soluble instant coffee, Blue Bottle wouldn’t open its doors until more than a century later. Additionally, Micro VCs and accelerators were few and far between…meaning businesses were forced to actually make money to stay in operation. (Add to that Stanford’s crushing 49-0 loss to Michigan in the first ever Rose Bowl right at the beginning of 1902 and it made for a tough time for Silicon Valley’s tech elite).
1901 was also the year that saw the birth of the world’s first Unicorn – long before Aileen Lee coined the term in 2013. Through a merger of 10 different steel and manufacturing companies, U.S. Steel Corporation became the world’s first billion dollar company with an authorized capitalization of $1.4B (just under $40B in today’s money).
The names surrounding its origin remain recognizable to this day and adorn skyscrapers, foundations, and institutions across the globe. There was John Pierpont Morgan, who entered the steel industry a few years prior to the founding of U.S. Steel and is better known for the massive financial firm now bearing his name as well as his rescue of the U.S. economy during the Panic of 1907. There was also Andrew Carnegie who founded Carnegie Steel in 1873 and agreed to be bought out by Morgan for just south of $500MM in bonds and stock of the newly created U.S. Steel in order to retire to a life of philanthropy. Additionally, two Rockefellers, Marshall Field, and Charles M. Schwab (not to be confused with Charles R. Schwab) had key seats at the table during the formative years of the business.
The Not So Lean Startup
1902 was the first full year of operation for the fledgling business, a year in which they employed over 168,000 people and had a payroll figure of $120,528,343 (in 1902 dollars). For perspective, U.S. Steel had a larger employee headcount than contemporary behemoths like Apple (115,000 employees), Amazon (154,000 employees) or Microsoft (128,000 employees).
Like many of today’s billion dollar companies, U.S. Steel paid its rapidly growing base of employees more on average than a typical American worker.
We can only assume these wage discrepancies caused a massive influx of free trade, organic coffee shops and dog yoga studios into the early 20th century Youngstown, Ohios and Gary, Indianas of the world.
It’s not being a hipster if computers haven’t been invented yet!
Predictable Revenue is easy when your Board of Directors runs the economy
Today, investors and pundits worry about companies with negative unit economics, high burn rates, and unsustainably high valuations. For U.S. Steel, the only concern may have been where to find a safe big enough to store all the cash it was throwing off each month.
In addition to its impressive top line numbers, the company was highly profitable and grew that profitability each month on a Same Month YoY basis.
And while regulators may have had issues with the business, investors likely had trouble speaking a questioning word through the wide smiles they had on their faces as they walked to deposit $56,52,867 in dividends in the bank.
At the end of 1902, the company was left with a cash balance of over $50,000,000. Imagine all the passive-aggressive bus stop advertising they could buy today with that kind of money!
Life Before AWS
Today’s companies are fortunate to live in the age of AWS and WeWork, where two or three people can build a product, find some users or revenue, and display enough traction to raise capital from investors. Launching a startup today is significantly less capital intensive than it was 20 or even 10 years ago. 115 years ago?
In its first full year of operation, U.S. Steel spent over $29MM on the maintenance and renewal of capital equipment alone…
…and was mining millions upon millions of tons of iron ore all across the world.
The inventory of hard assets in most early stage companies today consists of nothing more than a few MacBooks and a ping pong table. Guilty…
U.S. Steel Today
With a current market cap of just under $1.3 billion, the company is worth less (on a non-inflation adjusted basis) than it was over 100 years ago. It remains one of the largest integrated steel companies in the world (and the largest in the U.S.) but, of course, that that title means significantly less than it did in the days of Morgan and Carnegie.
And while it may be long in the tooth, the stock chart below shows that the company still appears to have a taste for the boom and bust lifestyle of the early 20th century — which, frankly, seems to be the lifestyle many of today’s emerging unicorns favor as well.
And because there is never a bad time for a Godfather clip, we are compelled to mention that the company played a crucial role in the 20th century rise of America’s industrial might (for better and worse) and became a name that every outsider – from the Corleone family to a number of smaller, more nimble competitors – strived to outdo.
founders
Metrics and data
Rockstart Digital Health Accelerator Startup Metrics Template
Rockstart Digital Health Accelerator – Startup Metrics Template
In early 2015 Rockstart, already a well-known name in the European startup community, launched a new digital health accelerator focused on making a sustainable impact on global health systems.
We have partnered with Rockstart to put together a template that you can start using today to get a high-level understanding of how your business looks today and where your growth is leading you in the future.
We went a little longer than 3 minutes with this one but we promise it is worth it!
What startup metrics matter to an early stage digital health company?
As with any early-stage company, focus is key. This is why Rockstart puts each company’s Most Valuable Metric front and center on the business dashboard. The primary reason to have a single, understandable metric for your business is to cut out the noise that comes with trying to track (and take action on) every single thing so that you can hone in on the one thing that drives your success. Read any startup post-mortem and you’ll quickly realize the negative impact that lack of focus can have on a company.
In the digital health sector, companies don’t all fit within the same bucket from a business model perspective. The first Rockstart Digital Heal Accelerator class has hardware companies (like Med Angel), marketplaces (like Dinst), and SaaS businesses (like Mount) who all likely have different true north metrics.
Revenue and Net Burn – Are you becoming more cash efficient over time?
The reality in many early stage technology companies still searching for a sustainable business model is unprofitability. In many cases, companies focus solely on top line (revenue) growth and neglect the need to control costs around things like user acquisition. Taking this approach results in a very cash inefficient business model.
In cash efficient businesses, like the example in the video, a company grows revenue at an exceedingly faster rate than it grows its net burn. This leads to (eventually) a self-sustaining business and, in the interim, the ability to raise capital at more company-friendly terms. If you want to learn more about startup cash efficiency, we highly recommend this post from Hyde Park Ventures’ Guy Turner.
founders
Metrics and data
Version One Ventures Marketplace Metrics Template
Version One Ventures Marketplace Metrics Template
Version One Ventures, which closed a $35 million fund in late 2014, is one of North America’s top early stage VC investors. With investments in marketplace companies like Angellist, Indiegogo, and HandUp they are experts in taking companies from growth to scaling. Recently, the firm released a Guide to Marketplaces compiling those insights and and learnings to help you build your business.
What Marketplace Metrics should I be tracking?
This metric template, which you can access within Visible is inspired by a post from Version One’s Angela Tran Kingyens who was herself inspired by Christoph Janz and his SaaS Metrics template. Here is a deeper look at some of the marketplace metrics we talk about in the video and how you can apply them to your own business.
Gross Merchandise Volume (GMV), Revenue, and Take Rate
Simply put, Gross Merchandise Volume (GMV) is the total dollar value being transacted through your platform during a given time period. So if in one month there are 100 transactions done through your marketplace with an average size of $50, your GMV will be $5000. Pretty basic.
As Andreessen Horowitz put it in the Startup Metrics blog post, it is the “real top line” for a marketplace business.
As a single number, GMV is useful in helping understand the high level growth of the business and looks good in press releases and investor conversations. From an operational perspective, GMV gives you a starting point to better understand all of the underlying aspects of your business to more effectively allocate growth-focused resources.
GMV by time of year (think Airbnb and seasonal differences), time of day (Uber and rush hour vs. late night volume), and by location or market (any on-demand marketplace opening new markets)
GMV by acquisition channel. Marketplace companies, especially in the on-demand space, are often reliant on customer referrals and other types of paid advertisement to get to initial liquidity. If you understand how that channel compares with others (social, organic, etc.) – assuming you also know how much it costs to acquire a customer through each channel – your GMV trends by channel play an important part in helping you allocate your sales and marketing dollars.
A word to the wise…GMV is NOT the same thing as Revenue for a marketplace business. This is something to be aware of when discussing the growth of your company with investors, potential employees, or partners. To calculate revenue for a marketplace company, multiply your GMV by your Take Rate. Take Rate is the % that your business “takes” from each transaction on your platform.
In recent periods, companies either ignorant of the proper terminology or looking to play sleight of hand in order to spur investor interest have come under fire for misrepresenting the size of their business by using GMV to mean Revenue. Don’t make this mistake.
Marketplace Activity Growth
As we noted above, marketplaces are all about efficiently matching buyers and sellers. When a marketplace is making these matches successfully at scale, it is said to have reached liquidity. Maintaining liquidity over time is not an easy proposition, as human (customer support for both sides), technical (matching or suggestion algorithms), and hybrid (how to price your offering) considerations bring about a daily balancing act.
To add even more complexity, some marketplaces have more moving parts than just a single buyer and seller. For example, DoorDash customers are buying a product from the end restaurant but also the service of having a DoorDash driver pick up the food and deliver it in a timely manner.
Net Promoter Score
Net Promoter Score was also featured in our recent Shopify Ecommerce Template and for good reason. Any time two parties are transacting, trust is a key element. Am I getting a fair price? Is the product or service going to meet my expectations? Do I have protection in the event something goes wrong?
As the conduit for these transactions, maintaining a high degree of trust from buyers and sellers is crucial for a marketplace. Net Promoter Score, which asks customers (and sellers in the case of a marketplace business) how likely they are to refer your product or service to a friend or colleague, serves as a proxy for trust. If people and businesses on both sides are having good experiences on your platform, it can be assumed that they are being treated fairly and finding the value they are searching for.
Visible Templates make it quick and easy to get started on the path to successful Data Distribution. Whether you are looking to raise money, send investor updates to your current shareholders, or just keep your team operating smoothly, Visible Templates give you a framework to tell a story around your most important key performance data.
We have partnered with top VC investors, high-growth companies, and successful entrepreneurs to create templates that take just a few minutes to set up.
See All Visible Template Posts
Start Using Templates in Visible
founders
Product Updates
Xero Dashboards, Export Charts & Forecasting!
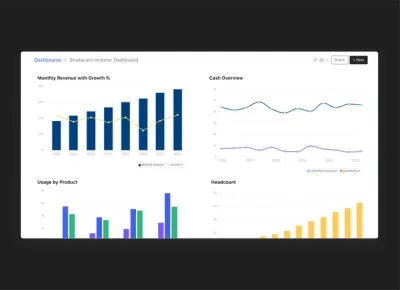
Charting Your Xero Data Using Dashboards
This release is packed with a lot of great functionality so “Hold on to your butts”, as close confident Samuel L Jackson would say.
First up. We just launched our Xero Integration. Easily connect to your Xero account and we will automatically pull TEN metrics from your Profit & Loss report and Balance Sheet. Start building beautiful Xero Dashboards in seconds!
That brings us to — Exporting: We constantly hear, “How can I print my screen?”…or “Is there an easy way to put my charts in a board deck?”. Fear no more, exporting your charts is now here!
Simply hover over any chart, click the gear and select “Export”. We’ll let you customize how you export the chart and support SVG, PNG, and JPEG image files. We also give you some clever defaults to nicely format charts for PowerPoint and Keynote! Read more about this in our Knowledge Base.
The chart below directly came from Visible! Feel free to use in any of your pitch decks.
Now we are grooving. Unicorn status isn’t in vogue like it used to be; however, hitting your forecasts will always be cool ;). Feel free to add as many data points into the future as you’d like! Click the “+” icon in any metric and you’ll start to see what 2020 looks like. And if you need help getting started with financial modeling, we’ve got you covered right here!
You can now export all of the data of your company. We are rolling this out in “beta” so shoot us an email and we will tell you how to access this easter egg.
We hope you enjoyed this update and as always please feel free to send us any feedback or questions our way!
#tellyourstory
-Mike and The Visible Team
founders
Metrics and data
Video: Shopify Ecommerce Dashboard
In building Visible and working hands-on with companies and investors from around the world, we have learned the importance of customization when it comes to what metrics your company tracks and how you track those metrics. For example, a late stage venture-backed Ecommerce company has different needs and goals than a 10 person online store. Both, however, have stakeholders who need to know how the business is performing and what they can do to help the business grow.
Thankfully, for every type of business, there are a ton of resources to help you understand what to track and how to track it. With Visible Templates, we have partnered with the creators of these resources – top VC investors, high growth companies, and successful entrepreneurs – to make it easy for you to build a metrics framework and a business dashboard that suits your company.
The Visible Shopify Ecommerce Dashboard
Shopify is one of the world’s largest Ecommerce platforms and a huge supporter of small businesses and Ecommerce startups anywhere. With thousands of companies of all shapes and sizes using the platform to build online stores and sell their products, Shopify truly has domain expertise when understanding what Ecommerce metrics are most important and how they can be applied to help you grow your business.
What Ecommerce metrics should I be tracking?
This template was initially inspired by a post from Mark Hayes, Shopify’s Director of Communications where he outlines 32 of the best Ecommerce metrics for a company to track. In the videto above, we have talked through a few of our favorites. Below, we jump in even further to three of the most important Ecommerce metrics your company can start using today: Net Promoter Score, Average Order Value, and Conversion Rate.
By the way…did you know you can now export all of your Visible charts in PNG, SVG, and JPG formats? That means better visuals for your pitch decks and other company storyelling materials.
Net Promoter Score (NPS)
In the past, we’ve written about Net Promoter Score as a way to gauge how likely your current investors are to refer you to other investors, partners, and key employees. The same concept holds true for measuring Ecommerce Net Promoter Score, which asks current customers a simple question on a scale of 1-10: How likely is it that you would recommend our company to a friend or colleague?
Because competition is high in the Ecommerce space and switching costs are low for many consumers, successful companies must take a customer-centric approach to growth. This mean embracing NPS as a holistic measure of business performance. Like all important business KPIs NPS doesn’t live in a bubble, it directly impacts other important Ecommerce metrics:
Lifetime Value of a Customer (LTV) – customers who fall in the 7-10 range on the NPS scale are likely happy with your product offering, have an affinity for the brand you have built, and can be expected to continue returning to purchase from your site (if you keep delivering on your company promise, of course).
Viral Coefficient aka K Factor – Your K factor or viral coefficient measures how many new, secondary users, an individual new user helps you acquire over their lifetime. Happier users refer more new business.
Total Orders and Average Order Value (AOV)
Running an Ecommerce business, you have two levers you can pull with regards to bringing money in the door (Revenue). The first is doing more volume, or in other words, increasing the total number of orders placed through your site. The second is Average Order Value (AOV), which is a measure of the size of each order placed on your site.
Increasing your Average Order Value can be accomplished in a number of ways, including offering future discounts, bundling similar products, or offering specials on shipping.
Conversion Rate
How effectively are you moving people from the top of the funnel (Visitors) to the bottom (Customers)? This is a core question you must ask yourself as you are designing your product as well as your marketing plan for your Ecommerce company.
At a high level, your Ecommerce conversion rate is simply the Number of Total Orders / Number of Visitors. As you get more sophisticated, you can begin tracking more steps in the Ecommerce funnel and honing in on how your conversion rates differ depending on lead source, purchase type, or even time of day.

founders
Reporting
What Investors Want
With the number of places available to gather information on how VCs invest – Mattermark and CB Insights on the paid side, Crunchbase and Angelllist for the burn conscious – it is no longer difficult to understand who you should be trying to raise money from.
Want to know who most prolific early stage FinTech investors are, for example? LMGTFY…the first result from CB Insights gives you a good starting point. Great! So it looks like 500Startups is very active in the space but they are a big firm, who should I be reaching out to there? Well…a second Google search might lead to something like this.
That was easy. It took me longer to write that last paragraph than it did to find a firm that may be interested in what I am working on and a partner at that firm that may be into what I am building. So why can raising capital be such a difficult and time consuming process, even for companies on a strong growth trajectory?
Put simply, it is because most founders haven’t given enough thought to what is behind each individual investor’s thesis. Go to any VC website and it is not hard to find out what their (publicly-facing) framework for making investment decisions looks like. Some of these theses are actually very interesting reads (Union Square Ventures, NeuVC, and OS Fund come to mind).
But if you have had the opportunity to speak at length with any successful investor, you will quickly come to find that what they are really looking for — beyond the eloquent “What We Invest In” essays used to make journalists fawn and LPs open checkbooks – is a combination of a good product, a highly functioning team, and a large, growing market. Mark Suster has written about this before, and so have many others.
Start with knowing where they start
As a founder, you are competing daily for two things – capital and talent. Raising money means selling your company in a way that puts you at a competitive advantage against other startups a VC could back. One of the quickest ways to build this advantage is by understanding which of the three aforementioned decision factors play the largest role in your target investor’s process. You need to know this before the first call or meeting. Instead of “here is what we do, are you interested?” switch the context to “here is why we are a perfect fit for your thesis.”
Make it easy for them to fit you into their existing mental framework of how they want to invest instead of forcing them to do all the work to organize their own thinking around your company. Remember, VCs need to sell too. They need to convince their partners that adding your company to the portfolio will have a positive impact. They also need to defend their investment decisions to LPs, often on a quarterly basis.
Build an investor interest profile
As capital has poured into the system, making money a commodity (side note, that post is from 2000…what’s the phrase, “history doesn’t repeat itself, but it rhymes”?) many VCs have gone on the offensive in order to gather attention and court the best companies. This means a larger social media presence, frequent blog posts, and more interviews. Use this to your advantage by studying what they say and trying to determine which factors loom largest in their decision making.
Marc Andreessen, for example, sees market as the determining factor in a company’s success or failure. In a different post than the one noted above, Upfront’s Mark Suster trumpets team as the most important factor in a VC’s decision of whether to investor or to pass. If you are fortunate enough to get an audience with one of the Marc/ks, lead with market and team respectively. Search further (I’m done Googling for you!) and you’ll find plenty of investors who base decisions first and foremost on whether a company’s product stands out amongst its competition.
Additionally, leverage the information your peers are putting out into the market. Funding announcements come fast and frequent these days (StrictlyVC and Term Sheet are good ways to keep up. So is Mattermark’s free iPhone app) and are often accompanied with quotes from CEOs and founders around the future of their businesses. The narrative put forth in these funding posts (ahem, press releases) are likely the same ones they used to court and close their investors. Go through enough announcements for companies your target investors have backed and you can build a very detailed profile of what they care about.
Want to go a step further? Reach out the CEOs who just closed the round. They’ll probably be happy that your inquiry isn’t another terrible sales pitch and will be open to help since they know first hand the challenges you are up against.
Raising capital isn’t a spray and pray endeavor. It also doesn’t operate on the self service model. Even at the seed stage closing a round of funding is a high-touch, big ticket sale where relationships need to be built and nurtured. Any company that closes a round from top investors must have some degree of competence in all three of the main decision-making factors (product, market, team). The ones who do it most efficiently know which areas they excel and which of those factors matter to each and every investor they take the time to meet with.
founders
Metrics and data
K Factor: What is your SaaS Company’s Viral Coefficient?
What is the K Factor/ Viral Coefficient?
The K factor or viral coefficient measures how many new, secondary users, an individual new user helps you acquire over their lifetime. For SaaS companies, if the software is good, the individual users will then refer the software to their friends, teams, and companies. In simple terms, a viral coefficient is a number which indicates how many new users a current user is referring to your business. This metric is used to measure the organic growth of a company. Understanding and improving the viral coefficient of your SaaS solution is a crucial part of achieving exponential growth.
How to Calculate SaaS K Factor/ Viral Coefficient
Here’s how to calculate your K Factor or Viral coefficient, according to Culttt:
Take your current number of users (let’s call it 100)
Multiply by the average number of invitations or referrals that your user base sends out (100 x 10)
Find the percentage of referrals that took the desired action, for example, signed up to be a new user. (12%)
If 12% of 1000 invitations signed up for your product you would have 120 new users.
You started with 100 users and you gained 120 users. So you divide the number of new users by the number of existing users to find your Viral Coefficient (120 / 100 = 1.2).
Kissmetrics notes that a positive viral coefficient rate means four things:
You are giving your customers a positive user experience
You’ve found product/market fit
You have a low cost of acquisition
You will probably have high profitability
A viral coefficient of 1 or above means that for every user you acquire, you’ll gain at least one additional user through the referral process. Each round of referrals creates a viral loop of growth.
Note: This is a very basic model that assumes no user growth from other sources (Paid Advertising, Content Marketing, etc.) If you want to start building charts like this to showcase the growth of your business, start your free 14-day trial on Visible
Why it’s important but Not the Only Metric for User Growth
Customer acquisition can be challenging for SaaS companies, but having a positive viral coefficient means you are acquiring new customers essentially for free.
But what if your viral coefficient is lower than 1? Many people argue that anything less than a K Factor of 1 is worthless, because this implies that your SaaS Company is failing. However this isn’t necessarily true. In reality, as long as you have a great product with repeat customers a K-Factor as low as 0.2 will still equate to a free extra user every time a user signs up. Furthermore, recommendations and referrals should not be your only measure of user adoption and growth. Many SaaS companies, such as ShoeBoxed which has a low viral coefficient score of around 0.16, build customer acquisition by using other channels such as SEO or PPC or content marketing to bring in new users. Instead of bringing in one person, they bring in 1.2 – 1.4. For them, the referral program is just a way to enhance the efforts of all other customer acquisition tools.
It’s also important to note that viral coefficient isn’t always predictable, and relying on referral programs doesn’t always equate to short term boosts in users. Some referral processes take longer to make conversions because potential users needed more exposure to multiple referrals before signing up. When digital signature company EchoSign tracked their viral conversions, they found that their average viral cycle (the time from initial user sign-up to successful referral sign-up) was 8 months.
Therefore you should always look at your viral loop as a side growth accelerator that will boost all of your other user acquisition efforts.
Great Resources for Viral Marketing and SaaS
Now that you know how to calculate your K-Factor and understand why it’s a great metric for growth, here are some great articles on viral marketing and some examples of the SaaS companies who are winning the viral marketing game:
How Referrals Built The $10 Billion Dropbox Empire, by Visakan Veerasamy for Referral Candy
The Best Referral Program Examples, by Brandon Gains at Referral SaaSquatch
Customer Acquisition & Monetization, by David Skok for For Entreprenuers
‘Startup Growth Engines: Case Studies of How Today’s Most Successful Startups Unlock Extraordinary Growth’, by Sean Ellis & Morgan Brown
This post is part of our Most Valuable Metrics series, helping your company understand how to develop a holistic framework for tracking your performance and telling your story to everyone who matters to your business. You can find previous posts in the series here:
Your Company’s Most Valuable Metric
How to Calculate Lead Velocity Rate (LVR)
Stealing the Right Growth Metrics for Your Startup
How to Calculate Bookings
What is your Investor Net Promoter Score?
How to Calculate SaaS Churn
How to Steal the Right Growth Metrics for Your Startup
How to Calculate Net MRR
founders
Product Updates
5 Steps to Build Your Dream Business Dashboard
Despite their popularity, most dashboards live up to only a fraction of their potential. In the first full flurry of enthusiasm for a newfangled technology, short shrift has been paid to how to design focused, thoughtful, and user-friendly dashboards.
Traditional dashboard design has tended to prioritize the right success metrics, only after which a hodgepodge of charts and a slew of gauges are stitched together in a mishmash single page. While the negative impact of such a design philosophy is curbed in small startups of three or so employees, it bodes poorly for any future expansion and development, when data naturally and exponentially starts to silo.
This article discusses five key strategies that founders and managers needs to keep in mind to make dashboard building and implementation effective.
1. Know Your Audience
Begin holistically: identify your target audience. Dashboards can be broadly categorized as strategic, analytical or operational. It’s difficult, if not impossible, for them to be all three at once. Tailoring your dashboard’s data to suit its single audience is key. Without a clear understanding of their requirements, you lack the ability to craft a meaningful message that resonates with your users.
Who is the dashboard’s end-consumer and what are their information requirements? Is the dashboard destined for financial monitoring by the executive team, or is it intended for daily analysis by the marketing team?
2. Avoid Clutter: Prioritize Data
Dashboards are easily cluttered. Given the tons of metrics that you could collect, and the space limitations of a dashboard, it’s imperative that you identify what data matters upfront.
Find the core. Your dashboard should have a core theme centering on a specific problem. A sales dashboard may ask “How can we make our pipeline more effective?” Or a marketing dashboard: “How can our marketing investments be optimizes?” Identifying this core will give you the logic for filtering superfluous information.
Thanks to your grip on your audience and their usage goals, you are better set to determine the focus of your interface design: key performance indicators (KPIs). Every application, from fitness trackers to powerful online analytics software, is built around a few KPIs. FitBit follows steps, calories in/out, and weight loss, while Google Analytics monitors conversions and traffic. Having KPIs in place ought give you a handle of the dashboard’s general tone and trajectory.
3. Keep It Clean, Keep It Simple
Variety for variety’s sake is categorically not the spice of dashboard design. Due in some part to their visual nature, designers have a tendency to ornament their dashboards with all sorts of visual distractions (for reference, check out this chamber of dashboard horrors).
Instead, restrict the aesthetic bells and whistles. Fewer extraneous graphics place focus right where it belongs: on the content.
For example, try to keep your color scheme simple: let green mean good and red bad. Adding in other colors like blue for improving, or orange for declining, quickly confuses things. Similarly be wary of piecharts! If the data falls in to a few simple categories, a pie chart can be effective. However, countless studies have testified to unreadability of the thinner pieces of a pie and their inability of communicate changes over time.
4. Make a story emerge!
It isn’t good enough to make the information available. If you want your data visualizations to be comprehensible and lead to action and change, you need to help tell a data-driven story. Begin by asking how the data will be viewed:
What story are you trying to tell?
Which data supports that story, and illustrates it most clearly for the end user?
Which specific data cluster is the user going to engage with most?
For example, ensure that data is displayed in logical groups. If a dashboard includes both Financial KPIs and Sales Pipeline, make sure to position the financial data together, while the Sales Pipeline data is displayed together in a separate logical bundle.
Similarly, the most important real estate on a dashboard – the top left hand corner – is typically earmarked for a company logo or a navigation tool. Given that most Western languages will read from top to bottom, left to right, that space should be a jumping-off point for most readers. It should be prioritized for critical data.
5. Put Perfectionism Aside
Ultimately, all thoughts of a silver bullet dashboard are idealistic. No dashboard is going provide every possible answer in a single view to an evolving business. Trying to do so only ends in a knotted web of choices, alternatives, and options for the end user.
Instead, it suffices that you know your users, you keep your data uncluttered, that your design is simple, and that you tell a story. With these four broad hallmarks of good data driven dashboard design, your developing business will be ready to generate relevant insights as it grows.
Ready to build your dream business dashboard?
Visible is the best way to tell the unique story around your company’s data, helping you keep everyone who matters to the business engaged in the business.
With the ability to create multiple dashboards, you can get even more granular about who you are presenting data to. Raising a new round? Build a “Potential Investors” dashboard to highlight some of your most important growth metrics. Looking to lean on industry best practices? Build a dashboard using one of our pre-made templates from firms like Andreesen Horowitz and Version One Ventures.
Start Your Free Trial

founders
Metrics and data
How to Calculate Net MRR
Learn How to Calculate Different Forms of MRR
This post is part of our Most Valuable Metrics series, helping your company understand how to develop a holistic framework for tracking your performance and telling your story to everyone who matters to your business. You can find previous posts in the series here:
Your Company’s Most Valuable Metric
How to Calculate Lead Velocity Rate (LVR)
Stealing the Right Growth Metrics for Your Startup
How to Calculate Bookings
What is your Investor Net Promoter Score?
How to Calculate SaaS Churn
How to Steal the Right Growth Metrics for Your Startup
Like every SaaS business, consistent subscription revenue is vital to your success. That’s why knowing your Monthly Recurring Revenue, or MRR, is so important. MRR is a measurement of the total predictable revenue you expect to make on a monthly basis.
Here’s a very simple example of MRR. You have three customers with the following subscription rates.
Customer X pays $75/month
Customer Y pays $50/month
Customer Z pays $25/month
Your total MRR is $75 + $50 + $25 = $150.
Net MRR gives your company a holistic overview of revenue gained from new subscriptions and upsells/upgrades and revenue lost from downgrades and cancellations.
MRR might not be part of GAAP (Generally Accepted Accounting Principles) or IFRS (International Financial Reporting Standards) but because of its importance in raising capital and gauging your sales and marketing success, it is crucial to understand and calculate correctly. Unintentionally misrepresenting your business to potential investors or developing your business plan on faulty data could spell disaster for your company.
To start, when calculating your MRR, do not include the following.
Full value of multi-month contracts: If you have quarterly, semi-annual, or annual contracts, normalize them to a monthly rate. Take the full subscription amount paid and divide it by the number of months in the contract. For example, your customer pays you $1,200 for an annual subscription. Dividing that by 12 gives you a monthly rate of $100 which you should use in your MRR calculation instead of $1,200.
One-time payments: One-time payments are not recurring, so you shouldn’t include them in your MRR calculation. One-time payments are not the same as multi-month payments. Even though a customer is paying a lump sum payment for those months, you expect the customer to make another lump sum payment at the end of the subscription period. With one-time payments, you don’t expect the customer to make another subscription payment.
Trialers: Until trial customers convert to being regular customers, don’t include their expected subscription values in your MRR calculation.
Now that you know how to determine your MRR and understand what should be excluded, you can calculate your net MRR. Net MRR includes the following:
New MRR: MRR from new customers
Expansion MRR: MRR from gained from existing customers when they upgrade their subscriptions
Churned MRR: MRR lost from existing customers when they downgrade or cancel their subscriptions
So, the formula for calculating Net MRR is:
Knowing the three elements of Net MRR is critical to understanding how your business is growing. Ideally your Expansion MRR should be greater than your Churned MRR each month. If it is, then you’re doing something right with your existing customers!
Want to read more on Monthly Recurring Revenue and how it impacts your business as your grow?
SaaS Metrics 2.0 – Detailed Definitions from Matrix Partners’ David Skok
Why most SaaS startups should aim for negative MRR churn by Christoph Janz of Point Nine Capital
SaaS Metrics for Fundraising from Intercom’s Bobby Pinero
Diligence at Social + Capital: Accounting for Revenue Growth from Jonathan Hsu

founders
Reporting
How to Find You Company’s Storytelling Framework
This post is excerpted from our first book, The Ultimate Guide to Startup Data Distribution. You can download the book for free and learn more about how other top companies are building and operating high-impact data distribution systems to keep everyone that matters engaged in the their business. Check out the other parts if you haven’t already:
Part 1. The Ultimate Guide to Startup Data Distribution
Part 2. Your Company’s Most Valuable Metric
Part 3. How to Find You Company’s Storytelling Framework
Part 4. ‘Steal’ the Right Metrics for Your Company (Coming Soon)
You can also find more on the topic of Startup Data Distribution here:
The 3 Key Pillars of Startup Data Distribution – OpenView Labs
How to Tell Your Company’s Story – Medium
The way that a company tracks and analyzes the key performance indicators around its product development and distribution as well as its customers and employees is key in determining whether its data distribution system will be effective and yield long term positive results. It doesn’t matter how often a management team communicates with team members, investors and any other stakeholders if the communication isn’t actionable and relevant to what drives the success of the business.
Blake Koriath, CFO at SaaS-focused seed fund High Alpha, likes to start wide when working with companies, focusing first on business model and company stage, then digging into exactly who will be viewing specific metrics and when.
1. Understand your Business Model
The way that you finance your operation, build your product, serve your customers, and generate revenue will be the primary driver behind what metrics you track. As Alistair Croll, one of the authors of “Lean Analytics” wrote, online businesses tend to primarily fall under one of the following business models:
He goes on to say that “no company belongs in just one bucket” as, for example, Amazon cares about “Transactional” KPIs when making sales on their site but looks to “Collaborative” KPIs when collecting product reviews.
2. Evaluate the stage of your business
In working with thousands of investors and operators over the last few years at Visible, we have come to understand the impact a company’s stage has on what metrics it should be tracking and how it should be tracking them.
Early stage teams may place more importance on things like cash in the bank and burn rate, hoping to extend the life of the business as they search for product/market fit and move from growth to scaling. Later stage companies, on the other hand, need to be much more qualitative in nature and understand how all of their different business units are contributing to their end goal as a business.
3. Determine who your intended audience is
When bringing a product to market, customer personas play a major role in things like pricing, messaging and feature set. When distributing key information about the performance of your business, stakeholder personas help inform which subset of metrics you present as well as when and how you present them.
Investors, according to High Alpha CFO Blake Koriath, are often interested in the highest level metrics, enough information to quickly understand general trends in the business and also understand where they can have the most impact. Overall Gross Margin, MRR Added and LTV are examples of metrics SaaS investors may be interested in seeing.
Executive team members fall next in the hierarchy and need to understand how the success of their team is contributing to the overall direction of the business (for example, Lead Velocity Rate for a a Sales Manager). Finally, team members are likely interested in the “atomic units” of those higher-level metrics. That is to say, how are their individual contributions bubbling up to impact the metrics that determine success for their teams?
Getting the right information to the right people at the right time is essential in telling the story around your company’s data. By focusing on targeted stakeholder personas, you can ensure that each group is empowered with the information they need to contribute most effectively to the growth of the organization.

founders
Metrics and data
Your Company’s Most Valuable Metric
This post is excerpted from our first book, The Ultimate Guide to Startup Data Distribution. You can download the book for free and learn more about how other top companies are building and operating high-impact data distribution systems to keep everyone that matters engaged in the their business. Check out the other parts if you haven’t already:
Part 1. The Ultimate Guide to Startup Data Distribution
Part 2. Your Company’s Most Valuable Metric
Part 3. How to Find Your Company’s Storytelling Framework
Part 4. ‘Steal’ the Right Metrics for Your Company (Coming Soon)
You can also find more on the topic of Startup Data Distribution here:
The 3 Key Pillars of Startup Data Distribution – OpenView Labs
How to Tell Your Company’s Story – Medium
To use a line from David Skok (the Godfather of SaaS metrics), “good metrics should be actionable and drive successful behavior.” To accomplish this, you first need to determine the end definition of “success” for your company. Since the mix of factors leading up to this point (Business Model + Stage + Audience), as well as the overall goals of every company, are different, there is no one size fits all approach to selecting your MVM.
The primary reason to have a single, holistic metric for your business is to cut out the noise that comes with trying to track (and take action on) everything so that you can hone in on the one thing that drives your success. Read any startup post-mortem and you’ll quickly realize the negative impact that lack of focus can have on a company. As you will see in the illustrations below, even growth stage and public companies often have a single MVM that they aspire to grow each period. In many cases, like with Airbnb or Meetup, the same MVM has been a guiding beacon since the early days.
Our Most Valuable Metric
At Visible, the metric most tied to our “success”, our MVM, is the number of companies we have actively using the platform on a monthly basis. The progress that we make on this metric helps us understand the performance of each one of our teams and can help us identify parts of the business bottlenecking our growth.
First of all, it gives us a good idea of how many people are coming in to the top of the funnel through different inbound and outbound channels then lets us know if our product is effective at “activating” those companies. Then, if a company is coming back to Visible each month to track and distribute their performance data, they are more likely to be inviting their investors, advisors and team members. As more companies in an investor’s portfolio begin sharing updates and metrics, the investor is more likely to become a paying customer. Similarly, team adoption within an organization grows as companies invite more employees.
In addition, since so many of the companies on Visible are what would be considered early or growth stage businesses, their continued expansion will bring new stakeholders into the fray, adding to the number of people who rely on us for the organization of their most crucial business data.
Related resource: Lead Velocity Rate: A Key Metric in the Startup Landscape
Early Stage Most Valuable Metrics
To give you some inspiration and help get you started, we’ve compiled a list of Most Valuable Metrics for top companies across a number of different stages and business models.
Whether you are interested in SaaS metrics like MRR (Buffer) or something a little less common, like Product Hunt’s “Product Page Visits,” you can do it on Visible.
Growth Stage Most Valuable Metrics
Even growth stage companies often have a single metric that everyone in the business – sales, product, customer success – focuses on growing each period. A holistic measurement of where the business is heading helps you tell your story more effectively and understand which supporting metrics are having the most impact on your growth.
Next Steps
Need help understanding what Most Valuable Metric is right for your business? We’ve created a series of posts that take a deep dive into some metrics that top startup companies are using to gain insight into their businesses.
Lead Velocity Rate (SaaS Metrics)
Bookings (SaaS Metrics)
Net Promoter Score
How to calculate churn rate (SaaS Metrics)
We will continue adding to this list each week so feel free to get in touch with any metrics you would like to learn more about.

founders
Operations
Product Hunt – 593 Days Later
Our First Time on Product Hunt
Back in the beginning days of 2014 Ryan Hoover shot me an email asking me to do an AMA on ProductHunt –at the time I still think it was a side project. (I’m user 1,077 #humblebrag)
I’m a sucker for product and community so was happy to help out. Also file Ryan’s email under things that don’t scale and how to build a community.
We launched Visible 1.0 on Product Hunt January 3, 2014, you can see the post and AMA here. The post got 93 upvotes I think we were near the top but honestly can’t recall.
We got some nice inbound from the post, definitely our largest day of traffic for Visible to that point. I don’t have any hard data on signups but do have the old app and marketing site Google Analytics profile.
Fast forward 593 Days.
Our Visible 2.0 release was featured on Product Hunt (find it here). We got 290 upvotes, finished 10th overall (the top hunt had 963 votes for reference) and we got 67 companies to sign up and become active on Visible. That number is impressive because we have a high barrier for a company to become active on Visible.
The day we were featured also ended up being our highest trafficked day in our marketing site’s history. Product Hunt referrals ended up over 235% from the first feature 593 days ago.
Other Notes:
While I’m incredibly impressed by the traffic and growth Product Hunt sent and the growth of the community, I thought the number was a little low. There are some factors like us not being in the Top 3, we didn’t heavily market it, etc.
However, after some quick digging I remembered that Product Hunt used to directly send you to a Hunt URL. This is represented as a “/” in the Referral Path in GA.
Today it takes an additional click on the “Get it” to get to a hunt. This totally makes as they want you to stay in the PH community, engage, etc. I’d be curious what would happen if they still directly sent you to the site!
Feel free to email me any questions about launching on Product Hunt.
Up & To the Right!
Mike

founders
Metrics and data
The Ultimate Guide to Startup Data Distribution
This post is excerpted from our first book, The Ultimate Guide to Startup Data Distribution. You can download the book for free and learn more about how other top companies are building and operating high-impact data distribution systems to keep everyone that matters engaged in the their business. Check out the other parts if you haven’t already:
Part 1. The Ultimate Guide to Startup Data Distribution
Part 2. Your Company’s Most Valuable Metric
Part 3. How to Find Your Company’s Storytelling Framework
Part 4. ‘Steal’ the Right Metrics for Your Company (Coming Soon)
You can also find more on the topic of Startup Data Distribution here:
The 3 Key Pillars of Startup Data Distribtion – OpenView Labs
How to Tell Your Company’s Story – Medium
How do you tell your company’s story?
Being able to effectively tell your company’s story has never been more important. As a company grows, it acquires more stakeholders – employees, investors, advisors – who need to remain engaged in the business in order to play their role most effectively. When those different stakeholders are empowered with the right information, it leads to better communication between teams, more introductions from investors to potential customers or employees and an overall culture of transparency that endows a feeling of ownership that stretches beyond what shows up on a cap table.
What is Data Distribution?
Data Distribution describes the systems and processes a company has for gathering key performance metrics and getting them to the right people at the right time in order to support the company’s growth. How your company builds your specific data distribution philosophy centers around how you want to tell your company’s story and who you want to tell that story to.
In short, Data Distribution is how well your company turns this…
Into this…
Why is Data Distribution Important?
Taking a company from its first round of funding to ultimate success (define that how you will) is no easy task. Companies fail for a number of different reasons and one of the more inexcusable is a breakdown in communication between founding teams, CEOs and investors, or leaders of different teams within in organization.
Building a solid process for your company’s Data Distribution means professionalizing the way that you approach communication to your stakeholders. There is a responsibility that comes with deploying capital for others (often millions of dollars) and employing people (often dozens) to help build your vision. Marc Andreessen touched on this responsibility in a recent interview with Fortune’s Dan Primack.
How can I implement Data Distribution at my company?
The way that a company tracks and analyzes the key performance indicators around its product development and distribution as well as its customers and employees is key in determining whether its data distribution system will be effective and yield long term positive results.
Blake Koriath, CFO at SaaS-focused seed fund High Alpha, likes to start wide when working with companies, focusing first on business model and company stage, then digging into exactly who will be viewing specific metrics and when.
Once you understand this and are committed to the idea of building out a data gathering system, your next step is to actually select the full set of metrics that make sense for your company. This is where things can get complicated, as there are hundreds of metrics to choose from as well as different time frames to consider and different ways of calculating certain metrics. Additionally, the amount of data produced in a growing technology company can be overwhelming for teams and founders.
Luckily, many thorough frameworks – crafted through years of experience by top investors and founders – already exist and can give you a great baseline to work from, no matter your business model or stage (we dive in depth into many of them in the book).
Remember, as Pablo Picasso whose paintings even most VCs can’t afford is credited with saying, “great artists steal.”
Many thanks to Nick Podraza for the awesome image. Check out more of his stuff here.
Where can I learn more about Data Distribution?
We thought you might ask. To start, you can download The Ultimate Guide to Startup Data Distribution, the first book we’ve ever published here at Visible. The book contains 40 pages of tactical insight to help you and your team tell the story around your key performance data more effectively.
Get the Book for Free
After you’ve read the book, get in touch! We’d love not only your feedback but also to spend 10 or 15 minutes on the phone sharing some of our learnings and helping your company get set up with an effective Data Distribution process. Shoot us an email and we’ll get back to you asap to get something set up!
Unlock Your Investor Relationships. Try Visible for Free for 14 Days.
Start Your Free Trial