
Hey there – We wanted to provide a quick recap of all of the major functionality that we’ve launched in April. As always feel free to send us any feedback, questions or comments.
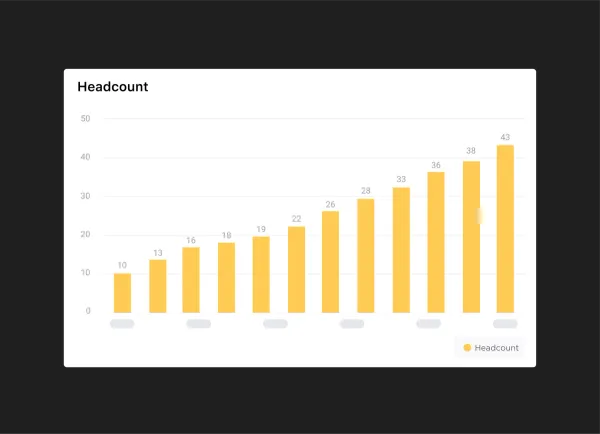
Data Labels on Charts
You can now add the actual value on the data point on your charts. This will display the actual values of the respective metric on the chart itself.
We suggest using charts with 8 or less data points to utilize data labels or you’ll quickly overcrowd the visualization.
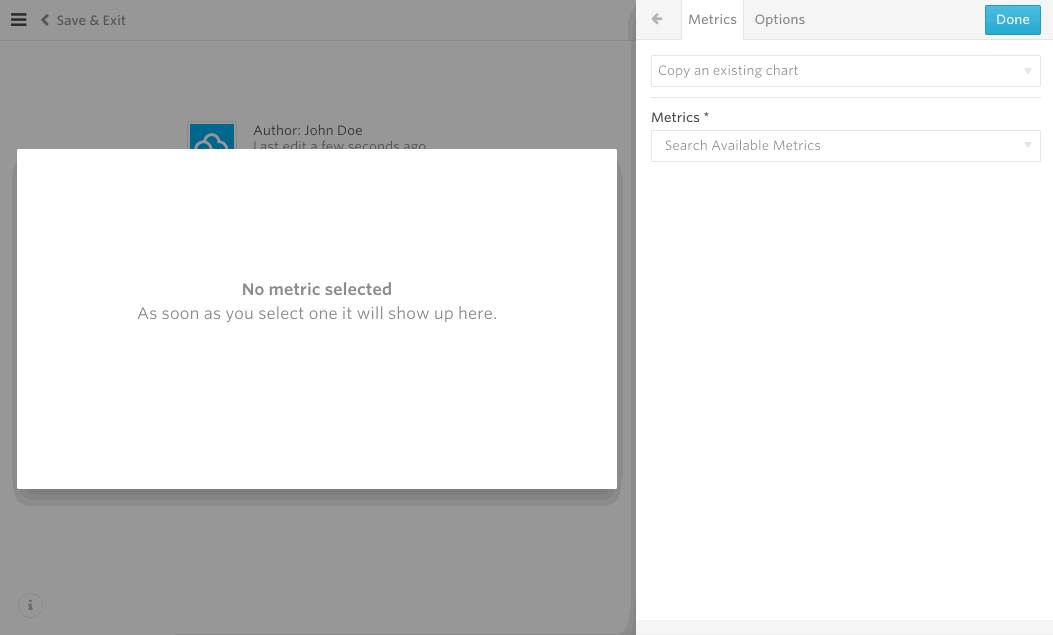
Chart Annotations
While you are creating or updating a chart you can now call out specific data points and add your own context through annotations. Simply click on any data point and add in text.

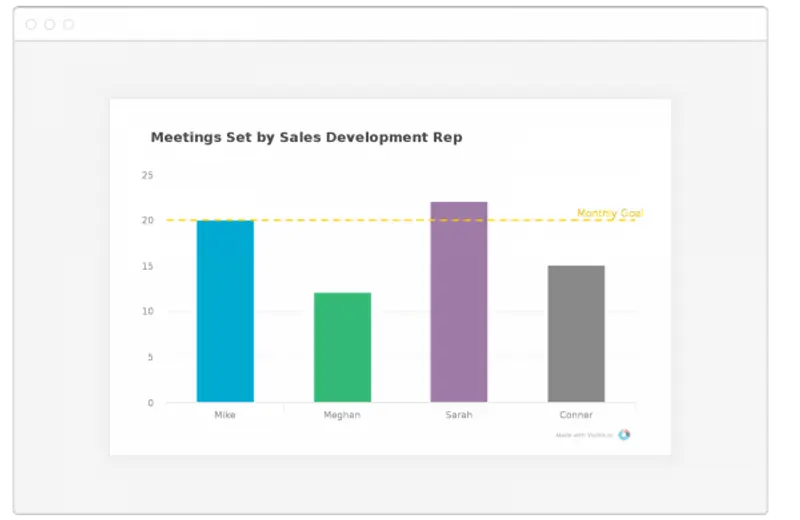
Goals
With any chart you can now add a goal, benchmark line or threshold targets. Simply navigate to the Options tab to customize your different goals and benchmarks.
File Attachments in Updates
Visible Updates now support file attachments. They’ll be available as one-click downloads and we’ll automatically detect the file type and add a nice icon for you! They are great for more granular financial statements, presentations or supplemental data sets.
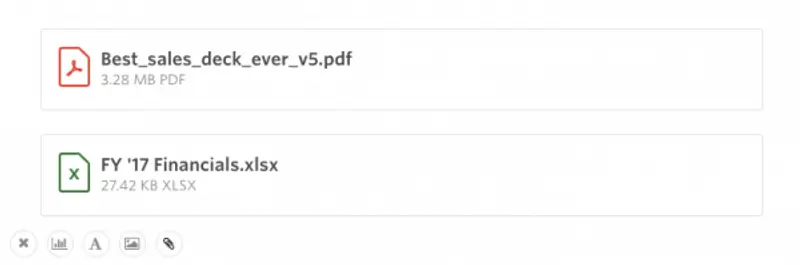
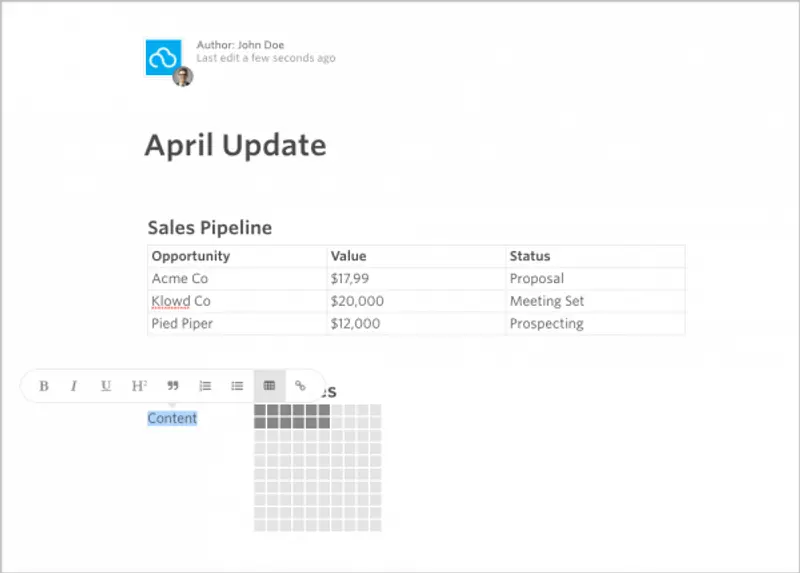
Table support in our text editor
Our Updates text editor now supports tables. They are great for structuring any of your qualitative information in Updates.
Other minor yet useful improvements:
- Better support for copying and pasting text from other text editors into Visible Updates!
- A very beautiful looking success message once you publish an Update in Visible.
-The Visible Team


