Case Study: How The Artemis Fund Uses Visible to Create Annual Impact Reports

About The Artemis Fund
The Artemis Fund is on a mission to diversify the face of wealth. Founded in 2019 in Houston Texas, the firm is led by General Partners Diana Murakhovskaya, Leslie Goldman, and Stephanie Campbell. Their team of five invests at the seed stage and leverages their conviction that the future of financial services and commerce will be written by diverse entrepreneurs. The Artemis Fund has invested in 20 disruptive fintech, e-commerce tech, and care-tech companies founded and led by women.
The Artemis Fund joined Visible in April 2021 with the primary objective of streamlining the way they collect both core financial metrics and impact metrics from their growing portfolio. For two years in a row now, The Artemis Fund has turned their metrics into a data-driven impact report using Visible’s portfolio monitoring tools.
Unexpected Benefits of Creating Impact Reports
Juliette Richert from The Artemis Fund shared the objective of their impact reports has broadened over time — reaping more benefits than they originally intended.
Impact is integral to The Artemis Fund’s investment thesis so there was always a desire to measure their impact; however, the primary objective of publishing their first impact report in 2021 was for fundraising from future LPs. Needing data to back up the narrative of your portfolio’s performance to LP’s is something we commonly hear from investors using Visible.
Over time, the team at Artemis realized the companies they were investing in were having an outsized impact on the communities they are serving. Juliette shared their “portfolio companies are very focused on their end users.” The Artemis team worked with their founders to identify which impact metrics are most integral to their businesses and then Artemis began tracking them using Visible’s portfolio monitoring tools. This larger ripple effect is a major driver behind Artemis’ work and so the team was excited to have actual metrics to back up their investment strategy.
The Artemis Fund’s 2022 impact report clearly communciates their thesis and the narrative behind their portfolio companies’ performance, both of which are made more compelling because they’re backed up by data.
This year they distributed their impact report to their wider network. The unexpected result was that it has become a valuable marketing tool for their fund for not just potential investors but it’s helped attract more founders to their deal pipeline as well. Artemis’ report clearly demonstrates that they’re not just paying lip service to investing and supporting female founders — they’re actually executing against their values and have the data to prove it.
“Using Visible streamlines the way we collect and digest metrics, helping us understand the health of our portfolio and address potential issues proactively.”
— Juliette Richert, The Artemis Fund
Choosing Which Impact Metrics to Track
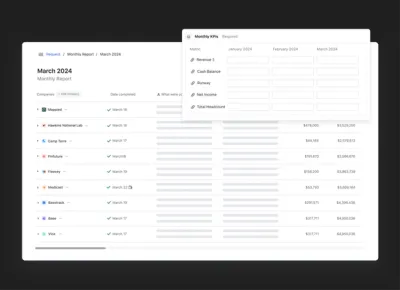
The first step of creating Artemis’ Impact Report was choosing which metrics to track from their portfolio companies and setting up a data Request in Visible.
Check out an Example Portfolio Data Request in Visible.
The Artemis Fund created 35+ custom metrics in Visible, some of which were collected from all companies, and the rest were assigned to specific companies based on the business model or sector.
Headcount Metrics
Artemis collects these metrics from all companies on an annual basis.
- FTE Headcount
- PTE/Contractor Headcount
- Diverse Headcount #
- Female Headcount #
Custom Impact Metrics
Artemis assigns these metrics to specific companies in VIsible and collects them on an annual basis. The list below is not comprehensive.
- CO2 Saved (Assigned to portfolio company DressX)
- Families Served (Assigned to portfolio company Hello Divorce)
- Musicians Served (Assigned to portfolio company Green Room)
Financial Metrics
Artemis collects these metrics on a monthly basis from all companies. The list below is not comprehensive.
- Cash Burn
- Cash Balance
- Revenue
- Expected Runway
- Total Funding
The Artemis Fund Collected Annual Impact Metrics with a 94% Response Rate Using Visible
Aggregating Impact Data into a Report
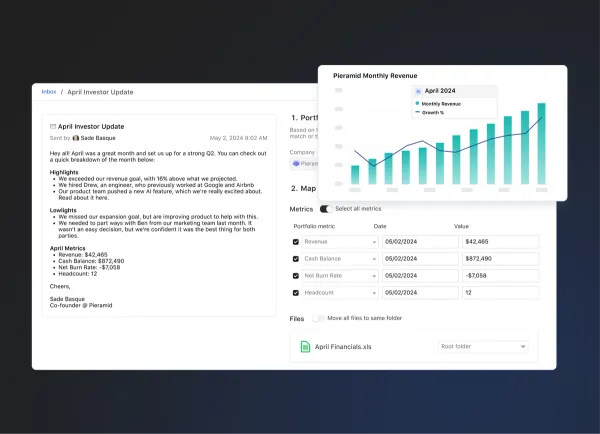
Next, The Artemis Fund aggregated their portfolio data within Visible using the Portfolio Metric Dashboard which provides quick insights such as the total, minimum, maximum, median for any metric.
The portfolio-wide metrics Artemis included in their report are Revenue & Capital for SMBs, Number of Families Served, and Number of Jobs created.

This year, instead of providing an overview of each company they chose to highlight specific companies in the form of a case study in their impact report. The result is a more digestible yet compelling report that certainly helps LPs and founders understand the type of companies Artemis’ chooses to back.
The entire compiled report is 17 slides. The Artemis Fund’s deck is hosted on Visible’s deck feature which allows them to distribute the deck via a shareable link and gives them control over their branding, email gating, password protection and more.
View the full impact report here.
Visible helps 350+ funds streamline the way they collect and analyze portfolio data.